La población de Estados Unidos casi se cuadriplicó durante el siglo XX (a una tasa de crecimiento de alrededor del 1,3% anual), de unos 76 millones en 1900 a 281 millones en 2000. [18] Se estima que alcanzó la marca de 200 millones en 1967 y la marca de 300 millones el 17 de octubre de 2006. [18] [19] La inmigración nacida en el extranjero hizo que la población de Estados Unidos continuara su rápido aumento, y la población nacida en el extranjero se duplicó de casi 20 millones en 1990 a más de 45 millones en 2015, [20] lo que representa un tercio del aumento de la población. [21] La población de Estados Unidos creció en 1,6 millones de 2018 a 2019, y el 38% del crecimiento se debió a la inmigración. [22] El crecimiento demográfico es más rápido entre las minorías en su conjunto y, según la estimación de 2020 de la Oficina del Censo, el 50% de los niños estadounidenses menores de 18 años son miembros de grupos étnicos minoritarios . [23]
En 2020, las personas blancas sumaban 235.411.507 o el 71% de la población, incluidas las personas que se identificaban como blancas en combinación con otra raza. Las personas que se identificaban solo como blancas (incluidos los blancos hispanos) sumaban 204.277.273 o el 61,6% de la población y los blancos no latinos constituían el 57,8% de la población del país. [24]
Los latinoamericanos representaron el 51,1% del crecimiento poblacional nacional total entre 2010 y 2020. [25] La población hispana o latina aumentó de 50,5 millones en 2010 a 62,1 millones en 2020: un aumento del 23% y un aumento numérico de más de 11,6 millones. [25] Se espera que los inmigrantes y sus descendientes nacidos en Estados Unidos proporcionen la mayor parte de las ganancias de población de Estados Unidos en las próximas décadas. [26]
Los estadounidenses de origen asiático son el grupo racial de más rápido crecimiento en Estados Unidos, con una tasa de crecimiento del 35 %. Sin embargo, los estadounidenses de origen asiático multirracial son el grupo de más rápido crecimiento en el país, con una tasa de crecimiento del 55 %, lo que refleja el aumento de los matrimonios interraciales en los Estados Unidos. [27] [28]
A partir de 2022 [update], los nacimientos de madres estadounidenses blancas siguen representando alrededor del 50% del total de EE. UU., lo que refleja una disminución del 3% en comparación con 2021. [29] En el mismo período de tiempo, los nacimientos de mujeres estadounidenses de origen asiático e hispanas aumentaron un 2% y un 6%, respectivamente. [30]
La tasa general de fertilidad al cierre de 12 meses aumentó de 56,6 a 57,0 en el primer trimestre de 2022 en comparación con el cuarto trimestre de 2021. [31]
Distribución por edad según grupos de edad seleccionados. [35]
0 – 14 años: 18,2%
15 – 24 años: 13,0%
25 – 54 años: 39,0%
55 – 64 años: 12,9%
65 años y más: 16,8%
Edad media por condado en 2022
46 o más
43 a 45,9
39 a 42,9
35 a 39,9
34,9 o menos
La edad media de la población total en 2021 es de 38,8 años; la edad media de los hombres es de 37,7 años; la edad media de las mujeres es de 39,8 años. [35]
Tasa de natalidad
12.023 nacimientos/1.000 habitantes (2023) [3] Comparación del país con el mundo: 151.º [36]
Tasa de mortalidad
10,45 muertes/1000 habitantes (estimación de 2021) [37] Comparación del país con el mundo: 78.º [36]
8,81 muertes/1000 habitantes (estimación de 2021)* [38] *tasa de mortalidad ajustada por edad
Tasa global de fecundidad (TGF)
Tasa de mortalidad total de Estados Unidos por horas extras desde 1820 hasta 2016
En 1800, la mujer estadounidense promedio tenía 7,04 hijos; [39] en la primera década del siglo XX, este número ya había disminuido a 3,56. [40] Desde principios de la década de 1970, la tasa de natalidad ha estado por debajo de la tasa de reemplazo de 2,1, con 1,72 hijos por mujer en 2018. [41]
La caída de la tasa de fertilidad en Estados Unidos de 2,08 por mujer en 2007 a 1,76 en 2017 se debió principalmente a la disminución de la tasa de natalidad de las hispanas, las adolescentes y las mujeres jóvenes, aunque la tasa de natalidad de las mujeres mayores aumentó. [42]
1.664 niños nacidos por mujer (2021). [43]
Edad media de la madre en el primer parto
Porcentaje de mujeres sin hijos por cohorte de edad en los EE. UU. a lo largo del tiempo
27,1 años (estimación de 2020) [43]
Tasa de dependencia
Mapa coroplético bivariado que compara el porcentaje estimado de la población de 65 años o más y de 17 años o menos en los Estados Unidos contiguos por condado, 2020
La tasa de dependencia es la relación entre la población en edad de trabajar y la población de edad avanzada, es decir, la población dependiente (que incluye a las personas de 0 a 14 años y de 65 años o más) y la población que sí lo hace (la parte productiva, de 15 a 64 años). Se utiliza para medir la presión sobre la población productiva. La tasa de apoyo es la relación entre la población en edad de trabajar y la población de edad avanzada, es decir, el recíproco de la tasa de dependencia de las personas mayores.
Tasa de dependencia total: 54,03 % (2021) [35] Comparación del país con el mundo*: 110.º [44]
Tasa de dependencia infantil: 28,11 % (2021) Comparación del país con el mundo*: 138.º
Tasa de dependencia de personas mayores: 25,92 % (2021) Comparación del país con el mundo*: 42.º
Tasa de apoyo potencial: 3,86 (2021) Comparación del país con el mundo*: 160.º
*Las proporciones están clasificadas de mayor a menor por país.
Esperanza de vida en Estados Unidos desde 1880Esperanza de vida en Estados Unidos desde 1960 por género
Esperanza de vida
Población total: 80,8 años (2023), [45] [46] 76,1 años (2021), 77,0 años (2020) [47]
Masculino: 78,5 años (2023), [45] [46] 73,2 años (2021), 74,2 años (2020)
Femenino: 82,9 años (2023), [45] [46] 79,9 años (2021), 79,9 años (2020)
La esperanza de vida media en los Estados Unidos ha estado disminuyendo desde 2014. Los Centros para el Control y la Prevención de Enfermedades citan tres razones principales: un aumento del 72% en las sobredosis en la última década (incluido un aumento del 30% en las sobredosis de opioides de julio de 2016 a septiembre de 2017, pero no diferenciaron entre sobredosis accidentales con una prescripción legal y sobredosis con opioides obtenidos ilegalmente y/o combinados con drogas ilegales, es decir, heroína, cocaína, metanfetamina, etc.), un aumento de diez años en la enfermedad hepática (la tasa para los hombres de 25 a 34 años aumentó un 8% por año; para las mujeres, un 11% por año), y un aumento del 33% en las tasas de suicidio desde 1999. [48]
De 2019 a 2020, la pandemia de COVID-19 contribuyó aproximadamente al 61% de la disminución de la esperanza de vida en los Estados Unidos. [49] Mientras que los aumentos en la mortalidad por lesiones no intencionales , enfermedades cardíacas , homicidios y diabetes contribuyeron al 11,7%, 5,8%, 2,9% y 2,8% de la disminución de la esperanza de vida de 2019 a 2020, respectivamente. [49] La esperanza de vida también ha variado según el grupo racial y étnico, siendo los asiáticos no hispanos los que tienen la esperanza de vida más alta y los indios americanos no hispanos los que tienen la más baja. [49] En 2021, la esperanza de vida al nacer en los Estados Unidos cayó por segundo año consecutivo, la primera caída de dos años desde 1961-1963. [50]
NOTA : Los datos de esperanza de vida al nacer para 2021 son provisionales.*
NH = No hispano.
LEB = Esperanza de vida al nacer
Las flechas de crecimiento ( / ) indican un aumento o disminución en la esperanza de vida total en comparación con años anteriores.
Tablas de vida
Densidad
El estado más densamente poblado es Nueva Jersey (1.263/mi 2 o 488/km 2 ).
La población está altamente urbanizada, con un 82,3% de la población residiendo en ciudades y suburbios. [5] Grandes conglomerados urbanos se extienden por la mitad oriental de los Estados Unidos (en particular el área de los Grandes Lagos, noreste, este y sureste) y los estados del nivel occidental; las áreas montañosas, principalmente las Montañas Rocosas y la cadena de los Apalaches, los desiertos en el suroeste, los densos bosques boreales en el extremo norte y los estados de las praderas centrales están menos densamente poblados; la población de Alaska se concentra a lo largo de su costa sur, con especial énfasis en la ciudad de Anchorage , y la de Hawái se centra en la isla de Oahu. [5] California y Texas son los estados más poblados, ya que el centro medio de la población estadounidense se ha desplazado constantemente hacia el oeste y el sur. [52] [53] La ciudad de Nueva York es la ciudad más poblada de los Estados Unidos [54] y lo ha sido desde al menos 1790 .
Tasa de crecimiento demográfico: 0,12 %. [35] Comparación del país con el mundo: 130.º
Nacimientos y fecundidad por raza
En 2021 nacieron un total de 3.659.289 bebés, un aumento del 1% con respecto a 2020. Además, los investigadores también analizaron los nacimientos por raza y descubrieron que las mujeres blancas e hispanas vieron aumentar el número de nacimientos aproximadamente un 2% entre 2020 y 2021. Mientras tanto, las mujeres negras y asiáticas vieron disminuir el número de nacimientos en un 2,4% y un 2,5%, respectivamente, durante el mismo período, mientras que las mujeres indígenas estadounidenses o nativas de Alaska vieron caer su número en un 3,2%. [58] También marca el primer aumento de nacimientos desde 2014. Antes de este informe, el número total de nacimientos había estado disminuyendo en un promedio del 2% por año. [58] Sin embargo, la tasa de fertilidad total (el número de nacimientos que las mujeres promedio tienen a lo largo de su vida) fue de 1.663,5 nacimientos por cada mujer. Esto todavía está por debajo del nivel de reemplazo, el nivel que una población necesita para reemplazarse a sí misma, que es, al menos, 2.100 nacimientos por mujer. [58]
Personas nacidas en Estados Unidos
Nota: Los hispanos se cuentan tanto por su origen étnico como por su raza, lo que da un número general más alto. Observe también que las flechas de crecimiento indican un aumento o una disminución en el número de nacimientos, no en la tasa de fertilidad. [64] [65] [66] [67]
NOTA :
NH = No hispano.
TFR = Tasa total de fecundidad (número de hijos nacidos por mujer).
Las flechas de crecimiento ( / ) indican un aumento o disminución en el número de nacimientos, no en la tasa de fertilidad, en comparación con el año anterior.
Porcentaje de nacimientos de mujeres blancas no hispanas que fueron su octavo hijo o más, por estado de EE. UU., en 2021
En las últimas décadas, Estados Unidos ha pasado de tener un 9% (1990) a un 15% (2020) de la población nacida en el extranjero. [70] Las pendientes de las partes superiores de las columnas de diferentes colores muestran la tasa de aumento porcentual de las personas nacidas en el extranjero que viven en los respectivos países.Porcentaje de población nacida en el extranjero en los EE. UU. a lo largo del tiempo desde 1850 hasta 2020
En 2017, de la población estadounidense nacida en el extranjero, alrededor del 45 % (20,7 millones) eran ciudadanos naturalizados, el 27 % (12,3 millones) eran residentes permanentes legales (incluidos muchos elegibles para convertirse en ciudadanos), el 6 % (2,2 millones) eran residentes legales temporales y el 23 % (10,5 millones) eran inmigrantes no autorizados. [71] Entre los inmigrantes vivos actuales en los EE. UU., los cinco principales países de nacimiento son México (25 % de los inmigrantes), China (6 %), India (6 %), Filipinas (5 %) y El Salvador (3 %). Alrededor del 13 % de los inmigrantes vivos actuales provienen de Europa y Canadá, y el 10 % del Caribe. [71] Entre los recién llegados, los inmigrantes asiáticos han sido más numerosos que los inmigrantes hispanos desde 2010; en 2017, el 37,4 % de los inmigrantes que llegaron fueron asiáticos y el 26,6 % hispanos. [71] Hasta 2017 y 2018, Estados Unidos lideró el mundo en reasentamiento de refugiados durante décadas, admitiendo más refugiados que el resto del mundo en conjunto. [72] Desde el año fiscal 1980 hasta 2017, el 55% de los refugiados provenían de Asia, el 27% de Europa, el 13% de África y el 4% de América Latina, huyendo de la guerra y la persecución. [72]
Tasa neta de migración (2022): 3,02 migrantes/1.000 habitantes. [36] Comparación de países con el mundo: puesto 35.º [36]
Tasa neta de migración* (2020-2021): 0,73 migrantes/1.000 habitantes. [73]
*(estimaciones a mitad de año)
A partir de 2017, el 13,6% (44,4 millones) de la población nació en el extranjero, un aumento del 4,7% en 1970, pero menos que el récord de 1890 del 14,8%. El 45% de la población nacida en el extranjero eran ciudadanos estadounidenses naturalizados. El 23% (10,3 millones) de la comunidad nacida en el extranjero es indocumentada , lo que representa el 3,2% de la población total. [71] Según el censo de 2010, América Latina y el Caribe es el grupo de región de nacimiento más grande, lo que representa el 53% de la población nacida en el extranjero. A partir de 2018, esta región sigue siendo la mayor fuente de inmigrantes a los Estados Unidos [74] [75] [76] En 2018, había casi 90 millones de inmigrantes e hijos de inmigrantes nacidos en Estados Unidos ( estadounidenses de segunda generación ) en los Estados Unidos, lo que representa el 28% de la población total de Estados Unidos. [77] En 2018, a 1.096.611 inmigrantes se les concedió la residencia legal permanente o temporal en los Estados Unidos [78]
Estadísticas vitales
Nacimientos, muertes y aumento natural en Estados Unidos 1935-2021
Matrimonios, familias y relaciones íntimas en Estados Unidos, 1970-2000Edad media en el primer matrimonio en EE.UU.
Según la Oficina del Censo de Estados Unidos , en 2021, la población de los Estados Unidos creció a un ritmo más lento que en cualquier otro año desde la fundación del país. [82] La población estadounidense creció solo un 0,1% con respecto al año anterior. [82] La población de los Estados Unidos ha crecido en menos de un millón de personas por primera vez desde 1937, con el crecimiento numérico más bajo desde al menos 1900, cuando la Oficina del Censo comenzó a realizar estimaciones anuales de población. [82] Aparte de los años anteriores, cuando el crecimiento de la población se desplomó a niveles históricamente bajos, el ritmo más lento de aumento en el siglo XX se produjo entre 1918 y 1919, cuando la epidemia de gripe y la Primera Guerra Mundial estaban en pleno apogeo. [82] Un crecimiento demográfico más lento ha sido la norma en los Estados Unidos durante algunos años, debido a la menor fertilidad y la migración internacional neta , así como al aumento de la mortalidad por el envejecimiento de la población. [82]
Dicho de otro modo, desde mediados de la década de 2010, los nacimientos y la migración internacional neta han ido disminuyendo, mientras que las muertes han aumentado. Estas tendencias tienen un efecto acumulativo de reducción del crecimiento demográfico. [82]
La pandemia de COVID-19 ha acelerado esta tendencia, dando como resultado un aumento de población históricamente lento en 2021.
La tasa de crecimiento estimada para 2021 es del 0,1%. [82]
La tasa de natalidad es de 11,0 nacimientos por cada 1.000 habitantes, en 2020. [43] Esta fue la tasa de natalidad más baja desde que se tienen registros. En 2020 hubo 3.613.647 nacimientos, la cifra más baja desde 1980. [43]
11,0 nacimientos/1.000 habitantes por año (datos finales de 2020).
11,4 nacimientos por cada 1.000 habitantes al año (datos finales de 2019). [43]
En 2020, los CDC informaron que hubo 1.676.911 matrimonios en 2020, en comparación con 2019, cuando hubo 2.015.603 matrimonios. [83] Las tasas de matrimonio variaron significativamente según el estado, desde 3,2 matrimonios por cada 1.000 habitantes en California hasta 21,0 matrimonios por cada 1.000 habitantes en Nevada.* [84]
5,1 matrimonios por cada 1.000 habitantes al año (datos provisionales para 2020). [83]
6,1 matrimonios por cada 1.000 habitantes al año (datos provisionales para 2019). [83]
*Las tasas se basan en recuentos provisionales de matrimonios por estado de ocurrencia.
En 2009, la revista Time informó que el 40% de los nacimientos fueron de mujeres solteras. [85] El siguiente es un desglose por raza para los nacimientos fuera del matrimonio: 17% asiáticos, 29% blancos, 53% hispanos (de cualquier raza), 66% nativos americanos y 72% afroamericanos. [86]
Según los CDC, en 2020 hubo al menos 1.461.121 nacimientos de mujeres solteras. En 2020, el 40,5 % de los nacimientos fueron de mujeres solteras. A continuación, se muestra el desglose por raza de los nacimientos de mujeres solteras: 28,4 % de blancos no hispanos, 70,4 % de negros no hispanos y 52,8 % de hispanos (de cualquier raza). [87]
Se cree que la caída de la tasa de natalidad entre 2007 y 2009 está asociada a la Gran Recesión . [88]
Según datos del gobierno federal de Estados Unidos publicados en marzo de 2011, los nacimientos cayeron un 4% entre 2007 y 2009, la mayor caída en Estados Unidos en un período de dos años desde los años 1970. [90]
Los nacimientos han disminuido durante tres años consecutivos y ahora están un 7% por debajo del pico de 2007. [91] Esta caída ha continuado hasta 2010, según datos publicados por el Centro Nacional de Estadísticas de Salud de Estados Unidos en junio de 2011. [91] Numerosos expertos han sugerido que esta disminución es en gran medida un reflejo de condiciones económicas desfavorables. [92] Esta conexión entre las tasas de natalidad y las crisis económicas se debe en parte al hecho de que las tasas de natalidad estadounidenses han caído ahora a niveles comparables a la Gran Depresión de los años 1930. [93] Las tasas de natalidad entre adolescentes en Estados Unidos están en el nivel más bajo de la historia del país. [94] De hecho, las tasas de natalidad entre adolescentes en los EE. UU. han disminuido de manera constante desde 1991 hasta 2011, excepto por un breve aumento entre 2005 y 2007. [94] La otra aberración de esta disminución, por lo demás constante, de las tasas de natalidad entre adolescentes es la disminución del 6% de las tasas de natalidad entre las jóvenes de 15 a 19 años entre 2008 y 2009. [94] A pesar de estos años de disminución, las tasas de natalidad entre adolescentes en los EE. UU. siguen siendo más altas que en otras naciones desarrolladas. [94] También prevalecen las diferencias raciales en las tasas de natalidad y embarazo entre adolescentes. Las tasas de embarazo entre las adolescentes indias estadounidenses/nativas de Alaska, hispanas y negras no hispanas son más del doble de las tasas de natalidad entre las adolescentes blancas no hispanas. [95]
Tabla demográfica de Estados Unidos, 1935-2023
[96] [33] [34]
p = datos provisionales
Estadísticas vitales actuales
[112]
Todas las cifras actuales de esta sección son provisionales y pueden cambiar en futuras actualizaciones. Para obtener más información, consulte el enlace de referencia.
Tasas de fecundidad total por estado
Tabla de población proyectada de EE.UU.
Las proyecciones de 2017 de la Oficina del Censo de los Estados Unidos se elaboraron utilizando el método de componentes de cohorte. En este método, los componentes del cambio de población (fecundidad, mortalidad y migración neta) se proyectan por separado para cada cohorte de nacimiento (personas nacidas en un año determinado). La población base se avanza cada año utilizando las tasas de supervivencia proyectadas y la migración internacional neta. Cada año, se agrega una nueva cohorte de nacimiento a la población aplicando las tasas de fertilidad proyectadas a la población femenina.
Desde 1790
En 1900, cuando la población estadounidense era de 76 millones, había 66,8 millones de estadounidenses blancos en Estados Unidos, lo que representaba el 88% de la población total, [119] 8,8 millones de estadounidenses negros, de los cuales aproximadamente el 90% todavía vivían en los estados del sur, [120] y un poco más de 500.000 hispanos. [121]
Según la ley de Inmigración y Nacionalidad de 1965 , [122] el número de inmigrantes de primera generación que viven en los Estados Unidos ha aumentado, [123] de 9,6 millones en 1970 a alrededor de 38 millones en 2007. [124] Alrededor de un millón de personas inmigraron legalmente a los Estados Unidos por año en la década de 1990, frente a 250.000 por año en la década de 1950. [125]
En 1900, los blancos no hispanos comprendían casi el 97% de la población de las 10 ciudades más grandes de Estados Unidos . [126] La Oficina del Censo informó que las minorías (incluidos los blancos hispanos) constituían el 50,4% de los niños nacidos en Estados Unidos entre julio de 2010 y julio de 2011, [127] en comparación con el 37% en 1990. [128]
En 2014, el estado con la tasa de fertilidad más baja fue Rhode Island, con una tasa de 1,56, mientras que Utah tuvo la tasa más alta con una tasa de 2,33. [64] Esto se correlaciona con las edades de las poblaciones de los estados: Rhode Island tiene la novena edad media más alta en los EE. UU. - 39,2 - mientras que Utah tiene la más joven - 29,0. [129]
En 2017, la tasa de natalidad en Estados Unidos sigue estando muy por debajo del nivel de reemplazo necesario (al menos 2,1 hijos por mujer para no experimentar descensos demográficos), ya que los nacimientos entre las mujeres blancas estadounidenses cayeron en los 50 estados y en el Distrito de Columbia. Entre las mujeres blancas no hispanas, ningún estado tuvo una tasa de fertilidad por encima del nivel de reemplazo. Entre las mujeres negras no hispanas, 12 estados alcanzaron por encima del nivel de reemplazo necesario. Entre las mujeres hispanas, 29 estados lo hicieron. [130] Para las mujeres blancas no hispanas, la tasa de fertilidad total más alta se registró en Utah, con 2,099, y la más baja en el Distrito de Columbia, con 1,012. Entre las mujeres negras no hispanas, la tasa de fertilidad total más alta se registró en Maine, con 4,003, y la más baja en Wyoming, con 1,146. Para las mujeres hispanas, la tasa de fertilidad total más alta se registró en Alabama, con 3,085, y la más baja en Vermont, con 1,200, y Maine, con 1,281. [130] [131] Debido al envejecimiento y las bajas tasas de natalidad entre la gente blanca , las muertes ahora superan en número a los nacimientos entre la gente blanca (no hispana) en más de la mitad de los estados del país. [132]
En 2018, los nacimientos en Estados Unidos cayeron al nivel más bajo en 32 años. [133]
1,88 para los hispanos (de todos los grupos raciales) [43]
( Tenga en cuenta que aproximadamente el 95% de los hispanos están incluidos como "hispanos blancos" por los CDC, que no reconocen la categoría "Alguna otra raza" del Censo y cuentan a las personas en esa categoría como blancas).
As of 2011[update], about 250 million Americans live in or around urban areas. That means more than three-quarters of the U.S. population shares just about three percent of the U.S. land area.[145]
The following table shows the populations of the top twenty metropolitan areas.
Race and ethnicity
Hispanics and Non-Hispanics in the United States (2020 census)[7]
U.S. race by Hispanic origin demographics from 1940 to 2020Ethnic origins in the United StatesEthno-racial makeup of the United States by single year ages from 1990 to 2020Ethno-racial makeup of the United States by single year ages in 2020
Race
Population pyramid by race/ethnicity in 2020
The United States Census Bureau collects racial data in accordance with guidelines provided by the U.S. Office of Management and Budget (OMB), and these data are based on self-identification. Many other countries count multiple races based on origin while America compiles multiple dozens of ethnicity groups into skin color grouping them together.[153] The racial classifications and definitions used by the U.S. Census Bureau are:[154]
White: a person having origins in any of the original peoples of Europe, the Middle East, or North Africa.[155] It includes people who indicate their race as "White" or report entries such as English, Iranian, Irish, German, Italian, Spanish, Portuguese, Lebanese, Arab, Moroccan, or Caucasian.
Black or African American: a person having origins in any of the Black racial groups of Africa.[155] It includes people who indicate their race as "Black, African Am." or report entries such as African American, Kenyan, Nigerian, or Haitian.
American Indian or Alaska Native: a person having origins in any of the original peoples of North and South America (including Central America) and who maintains tribal affiliation or community attachment.[155] This category includes people who indicate their race as "American Indian or Alaska Native" or report entries such as Navajo, Blackfeet, Inupiat, Yup'ik, Central American Indian groups, or South American Indian groups.
Asian: a person having origins in any of the original peoples of East Asia, Southeast Asia, or the Indian subcontinent including, for example: Bangladesh, Cambodia, China, India, Japan, Malaysia, Pakistan, the Philippines, South Korea, Taiwan, Thailand, and Vietnam.[155]
Some other race: includes all other responses not included in the "White", "Black or African American", "American Indian or Alaska Native", "Asian", and "Native Hawaiian or other Pacific Islander" racial categories described above includes Asians from West Asia or Russia (non-European Russia) and White Africans.
Two or more races: people may choose to provide two or more races either by checking two or more race response check boxes, providing multiple responses, or some combination of check boxes and other responses.
Data about race and ethnicity are self-reported to the Census Bureau. Since the 2000 census, Congress has authorized people to identify themselves according to more than one racial classification by selecting more than one category. Only one ethnicity may be selected, however, because the Census Bureau recognizes only two ethnicities – "Hispanic or Latino" and "Not Hispanic or Latino" – which are mutually exclusive since you can be one or the other, but not both. The singular term Hispanic has been supplanted as a federally-recognized ethnicity by the combined "Hispanic or Latino," defined by the Census Bureau as a person of Cuban, Mexican, Puerto Rican, Cuban, South or Central American, or other Spanish culture or origin, regardless of race.[156]
According to the Census Bureau website, the racial composition of the United States in 2021 was:[157]
According to the 2022 American Community Survey, the racial composition of the United States in 2022 was:[158][159]
Distribution of Total Population by Race, 1900 to 2020 (in %)
Hispanic are shown like part of the races. Source: U.S. Census Bureau.[141][134]
*Data are shown for the White, Black or African American, American Indian and Alaska Native, Asian and Native Hawaiian and Other Pacific Islander, and Some other race alone populations.
Median age by each race alone & ethnicity, 2021
Source: United States Census Bureau.[160]
Median age by race alone or in combination & ethnicity, 2021
Source: United States Census Bureau.[160]
Hispanic or Latino origin
CensusViewer US 2010 Census Latino Population as a heatmap by census tract
The U.S. Office of Management and Budget (OMB) defines "Hispanic or Latino" as a person of Cuban, Mexican, Puerto Rican, Dominican, South or Central American, or other Spanish culture or origin regardless of race. People who identify with the terms "Hispanic" or "Latino" are those who classify themselves in one of the specific Hispanic or Latino categories listed on the decennial census questionnaire and various Census Bureau survey questionnaires – "Mexican, Mexican Am., Chicano" or "Puerto Rican" or "Cuban" – as well as those who indicate that they are "another Hispanic, Latino, or Spanish origin."[170] People who identify their origin as Hispanic or Latino may be of any race.[154]
Population distribution by Hispanic origin 1970–2020 (in %)
Source: U.S. Census Bureau, decennial census of population, 1970 (5-percent
sample), 1980 to 2020.[134]
Median age of each race alone, 2021 (Hispanic)
Source: United States Census Bureau.[160]
Median age of each race alone or in combination, 2021 (Hispanic)
Source: United States Census Bureau.[160]
Note: Hispanic origin is considered an ethnicity, not a race. Hispanics may be of any race.
Indigenous peoples
As of 2020, there are 9,666,058 people identifying as American Indian and Alaska Native people in the United States, including those identifying with more than one race,[171] representing around 3% of the U.S. population. This number includes not only groups indigenous to the United States, but any Indigenous people of the Americas,[172] including Mesoamerican peoples such as the Maya, as well as Canadian and South American natives. In 2022, 634,503 Indigenous people in the United States identified with Central American Indigenous groups, 875,183 identified with the Indigenous people of Mexico, and 47,518 identified with Canadian First Nations.[173] Of the 3.2 million Americans who identified as American Indian or Alaska Native alone in 2022, around 45% were of Hispanic or Latino ethnicity,[174][175] with this number growing as increasing numbers of Indigenous people from Latin American countries immigrate to the US and more Latinos self-identify with indigenous heritage. Of groups Indigenous to the contiguous United States, the largest self-reported tribes are Cherokee (1,449,888), Navajo (434,910), Choctaw (295,373), ( Blackfeet (288,255), and Sioux (220,739). Additionally, 205,954 identify with an Alaska Native tribe. There are 573 federally recognized tribal governments[176] in the United States.[177]
The US Census Bureau classifies Native Hawaiians separately from American Indians and Alaska Natives, grouping them with Pacific Islanders instead. According to 2022 estimates, 714,847 Americans identified with Native Hawaiian ancestry.[178]
Other groups
There were 16.1 million veterans in 2022,[179] with only 6.2% of Americans having served in the Armed Forces.[180]
In 2010, The Washington Post estimated that there were 11 million undocumented immigrants in the country.[181] As of 2017, Pew Research reported that there an estimated 10.5 million undocumented immigrants in the U.S.[182]
In 2022, an estimated 1,849,176 adults were imprisoned in the US.[183]
Projections
A report by the U.S. Census Bureau projects a decrease in the ratio of non-Hispanic Whites between 2023 and 2060, a decline from 58.9% of the population to 44.9%. Non-Hispanic Whites are projected to no longer make up a majority of the population by 2050, but will remain the largest single ethnic group. Non-Hispanic whites made up 85% of the population in 1960.[185]
While non-Hispanic whites are projected to become a minority, the total White population (including Hispanics), will remain a majority from 2023 to 2060, falling from 75.5% to 72.3% of the population who are white alone according to the projections.[186] However, these projections are not directly comparable to other Census Bureau data, as they are based on a modified race dataset,[187] which does not include the "some other race" category used in census surveys.[188] Individuals identifying as “some other race” alone or in combination made up 16.2% of the population in 2022,[189] and they are reclassified into recognized race categories in the dataset used for the projections.[190] As a result, there is a significant discrepancy between the share of the white alone population in 2023 according to the projections (75.5%), and the estimated share of white alone (60.9%), as reported by the American Community Survey in 2022.[191]
The report foresees the Hispanic or Latino population rising from 19.1% today to 26.9% by 2060, the Black percentage barely rising from 13.6% to 14.8%, and Asian Americans upping their 6.3% share to 9.4%. The United States had a population of 333 million people in July 2023, and is projected to reach 355 million by 2040 and 364 million in 2060.[192][193][194][195][196] It is further projected that all of the increase in population from 2023 to 2060 will be due to immigrants.
Of the nation's children in 2060, 64% are expected to be of a minority ethnicity, up from 51% today. Approximately 32% are projected to be Hispanic or Latino (up from 26% in 2023), and 36% are projected to be single-race, non-Hispanic Whites (down from 49% in 2023). Racial and ethnic minorities surpassed non-Hispanic whites as the largest group of U.S. children under 5 years old in 2015.[197]
The fastest growing racial group in America is Asian Americans with a growth rate of 35%, however the multi-racial mixed Asian group is growing even faster, with a growth rate of 55%. Multi-racial Asians are therefore the fastest growing demographic group in America.[28][27]
In 2020, it was reported that 51.0% of births were to non-Hispanic white mothers.[136] In 2021, the percentage increased to 51.5%.[136][198] However, by 2022 the rate of births to white mothers had declined by 3%, dropping to 50% of all total births. In the same period, the rate of births to Asian and Hispanic women increased by 2% and 6%, respectively.[30][29]
Population pyramids of racial groups (of one race)
The United Nations projects a population of just over 400 million in 2060.[199]
The country's racial profile will be vastly different, and although whites will remain the single largest ethnic group in the U.S., they will no longer be a majority excluding White Hispanics by 2055 according to Pew Research Center. Growth in the Hispanic and Asian populations is predicted to almost triple over the next 40 years. By 2055, the breakdown is estimated to be 48% non-Hispanic white, 24% Hispanic, 16% Black, and 14% Asian.[199]
As of 2015[update], 14% of the United States' population is foreign born, compared to just 5% in 1965. Nearly 39 million immigrants have come to the U.S. since 1965, with most coming from Asia and Latin America. The 2015 Census Report predicts that the percentage of the U.S. population that is foreign-born will continue to increase, reaching 19% by 2060. This increase in the foreign-born population will account for a large share of the overall population growth.[199]
The average person in the U.S. of 2060 is likely to be older than the average person of 2018 today, and it is projected that almost one in four people will be 65 or older.[199]
U.S. Census Census Bureau projections
Percent minority 1970–2042 (2008 projections)
[134]
Note: "Minority" refers to people who reported their ethnicity and race as something other than non-Hispanic White alone in the decennial census.
Total US population
Self-reported ancestry
Most common ancestry group in the United States by county
This table displays all self-reported ancestries with over 50,000 members, alone or in combination, according to estimates from the 2022 American Community Survey. The total population of the US according to the survey was 333,287,550, and 251,732,240 people reported an ancestry. Of these, 175,054,020 reported a single ancestry, and 76,678,224 reported two or more ancestries.[202] Hispanic groups are not distinguished between total and partial ancestry:
The table below is based mainly on selected data as reported to the United States Census Bureau. It only includes the voluntary self-reported membership of religious bodies with 750,000 or more. The definition of a member is determined by each religious body.[209] In 2004[update], the US census bureau reported that about 13% of the population did not identify themselves as a member of any religion.[210][clarification needed]
In a Pew Research Survey performed in 2012, Americans without a religion (atheists, agnostics, nothing in particular, etc.) approached the numbers of Evangelical Protestant Americans with almost 20% of Americans being nonreligious (compared to just over 26% being Evangelical Protestant). If this current growth rate continues, by 2050, around 51% of Americans will not have a religion.[211]
Surveys conducted in 2014 and 2019 by Pew indicated that the percentage of Americans unaffiliated with a religion increased from 16% in 2007 to 23% in 2014 and 26% of the population in 2019.[212][213]
According to statistical data made by the Pew Research Center in 2021 about 63% of the US population is Christian, 28% is Unaffiliated, 2% is Jewish, 1% follows Buddhism, 1% follows Hinduism, 1% follows Islam and 2% follow traditional religions and others. Currently, the United States has the largest Christian population in the world (approximately 230-250 million) and the largest Protestant Christian population (approximately 150-160 million). The country also has the second largest Jewish community in the world (after Israel) and the largest Buddhist and Hindu communities in the West, as well as the largest number of followers of Islam in North America. The country has about 64 million non-affiliates (only China and Japan have more).[citation needed][214]
Religious affiliation within each state that has the largest deviation compared to the national average, 2001
Percentage of state populations that identify with a religion rather than "no religion", 2014
Plurality religion by state, 2001. Data is unavailable for Alaska and Hawaii.
According to Pew Research Center study released in 2018, by 2040, Islam will surpass Judaism to become the second largest religion in the US due to higher immigration and birth rates.[240]
Religions of U.S. adults
The United States government does not collect religious data in its census. The survey below, the American Religious Identification Survey (ARIS) 2008, was a random digit-dialed telephone survey of 54,461 American residential households in the contiguous United States. The 1990 sample size was 113,723; 2001 sample size was 50,281.
Adult respondents were asked the open-ended question, "What is your religion, if any?". Interviewers did not prompt or offer a suggested list of potential answers. The religion of the spouse or partner was also asked. If the initial answer was "Protestant" or "Christian" further questions were asked to probe which particular denomination. About one-third of the sample was asked more detailed demographic questions.
Religious Self-Identification of the U.S. Adult Population: 1990, 2001, 2008[241] Figures are not adjusted for refusals to reply; investigators suspect refusals are possibly more representative of "no religion" than any other group.
States in the United States by Catholic population according to the Pew Research Center 2014 Religious Landscape Survey.[242] States with Catholic population greater than the United States as a whole are in full red.
States in the United States by Evangelical Protestant population according to the Pew Research Center 2014 Religious Landscape Survey.[242] States with Evangelical Protestant populations greater than the United States as a whole are in full orange.
States in the United States by Mainline or Black Protestant population according to the Pew Research Center 2014 Religious Landscape Survey.[242] States with Mainline or Black Protestant population greater than the United States as a whole are in full purple.
States in the United States by non-Christian (e.g. Non-religious, Jewish, Muslim, Hindu, Buddhist) population according to the Pew Research Center 2014 Religious Landscape Survey.[242] States with non-Christian populations greater than the United States as a whole are in full blue.
States in the United States by non-Protestant and non-Catholic Christian (e.g. Mormon, Jehovah's Witness, Eastern Orthodox) population according to the Pew Research Center 2014 Religious Landscape Survey.[242] States with non-Catholic/non-Protestant Christian population greater than the United States as a whole are in full green.
LGBT population
The 2000 U.S. Census counted same-sex couples in an oblique way; asking the sex and the relationship to the "main householder", whose sex was also asked. Community Marketing & Insights, an organization specializing in analyzing gay demographic data, reported, based on this count in the 2000 census and in the 2000 supplementary survey, that same-sex couples comprised between 1.0% and 1.1% of U.S. couples in 2000.[243] A 2006 report issued by The Williams Institute on Sexual Orientation concluded that the number of same-sex couples in the U.S. grew from 2000 to 2005, from nearly 600,000 couples in 2000 to almost 777,000 in 2005.[244] A 2006 UCLA study reported that 4.1% of Americans aged 18–45 identify as gay, lesbian, or bisexual.[245]
A 2011 report by the Williams Institute estimated that nine million adults identify as gay, lesbian, or bisexual, representing 3.5% of the population over 18.[246] A spokesperson said that, until recently, few studies have tried to distinguish people who had occasionally undertaken homosexual behavior or entertained homosexual thoughts, from people who identified as lesbian or gay.[247] (Older estimates have varied depending on methodology and timing; see Demographics of sexual orientation for a list of studies.)
Foreign-born population
As of 2017, an estimated 44,525,458 residents of the United States were foreign-born,[248] 13.5% of the country's total population. This demographic includes recent as well as longstanding immigrants; statistically Europeans have resided in the US longer than those from other regions with approximately 66% having arrived prior to 2000.[249]
Citizens living abroad
As of April 2015, the U.S. State Department estimated that 8.7 million American citizens live overseas. Americans living abroad are not counted in the U.S. Census unless they are federal government employees or dependents of a federal employee.[250] A 2010 paper estimated the number of civilian Americans living abroad to be around 4 million.[251] So-called "accidental Americans" are citizens of a country other than the United States who may also be considered U.S. citizens or be eligible for U.S. citizenship under specific laws but are not aware of having such status (or became aware of it only recently).[252]
As of 2022, 1.6 million U.S. Americans live in Mexico, according to the State Department.[253]
Economics
Income
In 2020, the median household income in the United States was around $67,521, 2.9 percent less than the 2019 median of $69,560.[254] Household and personal income depends on variables such as race, number of income earners, educational attainment and marital status.
Counties in the United States by the percentage of the over 25-year-old population with bachelor's degrees according to the U.S. Census Bureau American Community Survey 2013–2017 5-Year Estimates.[258] Counties with higher percentages of bachelor's degrees than the United States as a whole are in full orange.
States in the United States by the percentage of the over 25-year-old population with bachelor's degrees according to the U.S. Census Bureau American Community Survey 2013–2017 5-Year Estimates.[258] States with higher percentages of bachelor's degrees than the United States as a whole are in full orange.
Counties in the United States by per capita income according to the U.S. Census Bureau American Community Survey 2013–2017 5-Year Estimates.[259] Counties with per capita incomes higher than the United States as a whole are in full green.
States in the United States by per capita income according to the U.S. Census Bureau American Community Survey 2013–2017 5-Year Estimates.[259] States with per capita incomes higher than the United States as a whole are in full green.
Counties in the United States by median nonfamily household income according to the U.S. Census Bureau American Community Survey 2013–2017 5-Year Estimates.[259] Counties with median nonfamily household incomes higher than the United States as a whole are in full green.
States in the United States by median nonfamily household income according to the U.S. Census Bureau American Community Survey 2013–2017 5-Year Estimates.[259] States with median nonfamily household incomes higher than the United States as a whole are in full green.
Counties in the United States by median family household income according to the U.S. Census Bureau American Community Survey 2013–2017 5-Year Estimates.[259] Counties with median family household incomes higher than the United States as a whole are in full green.
States in the United States by median family household income according to the U.S. Census Bureau American Community Survey 2013–2017 5-Year Estimates.[259] States with median family household incomes higher than the United States as a whole are in full green.
Economic class
Social classes in the United States lack distinct boundaries and may overlap. Even their existence (when distinguished from economic strata) is controversial. The following table provides a summary of some prominent academic theories on the stratification of American society:
Unemployment rate (seasonally adjusted)
U.S. unemployment by state in December 2015 (official, or U3 rate)[260]
<3.0%
<3.5%
<4.0%
<4.5%
<5.0%
<5.5%
<6.0%
<6.5%
≥6.5%
As of July 2020[update], the U.S. unemployment rate was 10.2 percent (U3 rate).
As of July 2019[update], the U.S. unemployment rate was 3.7 percent (U3 rate).
As of July 2018[update], the U.S. unemployment rate was 3.7 percent (U3 rate).
As of July 2017[update], the U.S. unemployment rate was 4.3 percent (U3 rate).[261]
As of July 2016[update], the U.S. unemployment rate was 4.9 percent (U3 rate).[261]
As of July 2015[update], the U.S. unemployment rate was 5.3 percent (U3 rate).[262]
As of July 2014[update], the U.S. unemployment rate was 6.2 percent (U3 rate).[261]
The U6 unemployment rate as of April 2017[update] was 8.6 percent.[263] The U6 unemployment rate counts not only people without work seeking full-time employment (the more familiar U3 rate), but also counts "marginally attached workers and those working part-time for economic reasons." Some of these part-time workers counted as employed by U6 could be working as little as an hour a week. And the "marginally attached workers" include those who have become discouraged and stopped looking, but still want to work. The age considered for this calculation is 16 years and over.
Urban Americans have more job opportunities than those in more rural areas. From 2008 to 2018, 72% of the nation's employment growth occurred in cities with more than one million residents, which account for 56% of the overall population.[264]
Generational cohorts
A definitive recent study of US generational cohorts was done by Schuman and Scott (2012) in which a broad sample of adults of all ages was asked, "What world events are especially important to you?"[265] They found that 33 events were mentioned with great frequency. When the ages of the respondents were correlated with the expressed importance rankings, seven (some put 8 or 9) distinct cohorts became evident.
Today the following descriptors are frequently used for these cohorts:
Baby boomers (also known as Boomers) – born from 1946 to 1964.[267]
Generation X – born from approximately 1965 to 1980.[267][269] In the U.S., some called Xers the "baby bust" generation because of the drop in birth rates following the baby boom.[270]
Millennials (also known as Generation Y) – born from approximately 1981 to 1996.[267]
Generation Z (also known as iGeneration, Digital Natives, or Zoomers) – born from approximately 1997 to 2012.[267]
Birth rate, death rate and natural increase rate in the United States 1935–2021
Subdivided groups are present when peak boom years or inverted peak bust years are present, and may be represented by a normal or inverted bell-shaped curve (rather than a straight curve). The boom subdivided cohorts may be considered as "pre-peak" (including peak year) and "post-peak". The year 1957 was the baby boom peak with 4.3 million births and 122.7 fertility rate. Although post-peak births (such as trailing edge boomers) are in decline, and sometimes referred to as a "bust", there are still a relatively large number of births. The dearth-in-birth bust cohorts include those up to the valley birth year, and those including and beyond, leading up to the subsequent normal birth rate. The baby boom began around 1943 to 1946.[271]
From the decline in U.S. birth rates starting in 1958 and the introduction of the birth control pill in 1960, the Baby Boomer normal distribution curve is negatively skewed. The trend in birth rates from 1958 to 1961 show a tendency to end late in the decade at approximately 1969, thus returning to pre-WWII levels, with 12 years of rising and 12 years of declining birth rates. Pre-war birth rates were defined as anywhere between 1939 and 1941 by demographers such as the Taeuber's, Philip M. Hauser and William Fielding Ogburn.[272]
Mobility
In 2021, 27.1 million Americans said they were living in a different place than a year before, compared to 29.8 million in 2020. This reflects an 8.4% mover rate, the lowest recorded in more than 70 years.[273]
^In fertility rates, 2.1 and above is a stable population and has been marked blue, 2 and below leads to an aging population and the result is that the population decreases.
References
^ a b"U.S. Population Estimated at 335,893,238 on Jan. 1, 2024".
^ a b c"List of Countries by Life Expectancy 2023". LL. December 2023. Retrieved April 5, 2023.
^ a b c"Births: Provisional Data for 2022" (PDF). cdc.gov. June 1, 2023. Retrieved June 3, 2023.
^"Infant Mortality". cdc.gov. June 22, 2022. Retrieved July 6, 2022.
^ a b c d e"North America: United States". Central Intelligence Agency. Retrieved February 11, 2020. This article incorporates text from this source, which is in the public domain.
^ a b c d"Population and Housing Unit Estimates Tables". Census.gov. Retrieved June 30, 2022.
^ a b c d e f g h i j k"Race and Ethnicity in the United States: 2010 Census and 2020 Census". U.S. Census Bureau. August 12, 2021. Archived from the original on October 7, 2021. Retrieved September 18, 2021.
^Kaczke, Lisa (March 25, 2019). "South Dakota recognizes official indigenous language". Argus Leader.
^"Samoa now an official language of instruction in American Samoa". Radio New Zealand International. October 3, 2008.
^"Guam". Encyclopædia Britannica. October 24, 2018.
^"Northern Mariana Islands". Encyclopædia Britannica. October 19, 2018.
^Crawford, James. "Puerto Rico and Official English". Language Policy.net. Retrieved April 27, 2011.
^"Census Bureau Projects U.S. and World Populations on New Year's Day". U.S. Department of Commerce. January 3, 2024. Retrieved September 26, 2024.
^ a b"Population Clock". U.S. Census Bureau.
^"Growth in U.S. Population Shows Early Indication of Recovery Amid COVID-19 Pandemic".
^"Population growth rate - The World Factbook". www.cia.gov. Retrieved July 6, 2022.
^"Illinois ranks as 'most normal state' in U.S. according to Washington Post data analysis". Illinois. WMAQ-TV. May 14, 2024. Retrieved May 15, 2024.
^ a b"Statistical Abstract of the United States" (PDF). U.S. Census Bureau. 2005. Retrieved October 25, 2015.
^"U.S. population hits 300 million mark". MSNBC. Associated Press. October 17, 2006. Archived from the original on October 17, 2006. Retrieved October 17, 2006.
^"Modern Immigration Wave Brings 59 Million to U.S." Pew Research Center's Hispanic Trends Project. September 28, 2015.
^"Changing Patterns in U.S. Immigration and Population". The Pew Charitable Trusts. December 18, 2014.
^"Annual Report 2021". USA Facts. Archived from the original on May 11, 2021. Retrieved May 11, 2021.
^"Children of color projected to be majority of U.S. youth this year". PBS NewsHour. January 9, 2020.
^"Racial and Ethnic Diversity in the United States: 2010 Census and 2020 Census". U.S. Census Bureau. Retrieved March 3, 2022.
^ a b"2020 Census Illuminates Racial and Ethnic Composition of the Country". Census.gov. Retrieved June 27, 2022.
^"U.S. Population Projections: 2005–2050". Pew Hispanic Center. February 11, 2008. Retrieved September 19, 2011.
^ a bLemi, Danielle Casarez (September 23, 2021). "Analysis - U.S. census racial categories have shifted over centuries. How will the jump in multiracials affect politics?". Washington Post. Retrieved June 19, 2023. "Asian Americans — the fastest-growing racial group in America — grew 35.5 percent, while Asian plus another race grew 55.5 percent."
^ a bFoster-Frau, Silvia (October 8, 2021). "'We're talking about a big, powerful phenomenon': Multiracial Americans drive change". Washington Post. Retrieved June 19, 2023.
^ a b"U.S. births in 2022 didn't return to pre-pandemic levels". STAT. Associated Press. June 1, 2023. Retrieved June 19, 2023. "Births to Hispanic moms rose 6% last year and surpassed 25% of the U.S. total. Births to white moms fell 3%, but still accounted for 50% of births. Births to Black moms fell 1%, and were 14% of the total."
^ a bAmerica, Good Morning (June 1, 2023). "Teenage birth rates in the US hit record lows in 2022: CDC report". Good Morning America. Retrieved June 19, 2023. "Among race/ethnicity between 2021 and 2022, the provisional number of births declined 3% for American Indian/Alaska Native and white women and by 1% for Black women from 2021 to 2022. However, birth rates rose 2% for Asian women and 6% for Native Hawaiian/Pacific Islander and Hispanic women."
^"Vital Statistics Rapid Release Quarterly Provisional Estimates". June 29, 2022. Retrieved July 10, 2022.
^"US Population Rises to 331,449,281, Census Bureau Says". U.S. News & World Report. Retrieved May 10, 2021.
^ a b"Statistical abstract of the United States, 1951, p8, Est. population of continental US excluding overseas armed forces" (PDF). U.S. Census Bureau.
^ a b"Current population reports, 1962, p2" (PDF). U.S. Census Bureau.
^ a b c d e"National Population by Characteristics: 2020-2021". Census.gov. Retrieved July 6, 2022.
^ a b c d"United States", The World Factbook, Central Intelligence Agency, July 13, 2022, retrieved July 20, 2022
^"Quarterly Provisional Estimates for Mortality Dashboard". www.cdc.gov. July 20, 2022. Retrieved July 20, 2022.
^Murphy, Sherry; Kochanek, Kenneth; Xu, Jiaquan; Arias, Elizabeth (2021). "Mortality in the United States, 2020" (PDF). NCHS Data Brief (427). CDC: 1–8. PMID 34978528. Retrieved March 1, 2022.
^Weinstein, Jay; Pillai, Vijayan K. (2016). Demography: The Science of Population (2nd ed.). Rowman & Littlefield. p. 208. ISBN 978-1-44223521-2.
^Doan, Alesha E. (2007). Opposition and Intimidation:The abortion wars and strategies of political harassment. University of Michigan. p. 40. ISBN 978-0-472099757.
^Belluz, Julia (May 22, 2018). "The historically low birthrate, explained in 3 charts". Vox. Retrieved December 27, 2018.
^Stone, Lyman (May 16, 2018). "Baby Bust: Fertility is Declining the Most Among Minority Women". Institute for Family Studies. Retrieved December 27, 2018.
^ a b c d e f g h i"Births: Final Data for 2020" (PDF). Centers for Disease Control and Prevention. Archived (PDF) from the original on February 7, 2022.
^"Dependency ratios - The World Factbook". www.cia.gov. Retrieved July 6, 2022.
^ a b c"Life expectancy at birth - The World Factbook". www.cia.gov. Retrieved April 5, 2024.
^ a b c"List of Countries by Life Expectancy 2023 | life —— lines". January 22, 2024. Retrieved April 5, 2024.
^ a bArias, Elizabeth; Tejada-Vera, Betzaida; Kochanek, Kenneth D; Ahmad, Farida B (August 2022). "Provisional Life Expectancy Estimates for 2021" (PDF). CDC.GOV. Retrieved August 31, 2022.
^Saiidi, Upton (July 9, 2019). "US life expectancy has been declining. Here's why". CNBC Markets.
^ a b c dArias, Elizabeth; Xu, Jiaquan (August 8, 2022). "United States Life Tables, 2020" (PDF). National Vital Statistics Reports: From the Centers for Disease Control and Prevention, National Center for Health Statistics, National Vital Statistics System. 71 (1): 1–64. PMID 35947823. Retrieved August 9, 2022.
^"CDC - NCHS - National Center for Health Statistics". www.cdc.gov. August 30, 2022. Retrieved August 31, 2022.
^ a b"PEPANNRES – Annual Estimates of the Resident Population: April 1, 2010 to July 1, 2018". U.S. Census Bureau. Archived from the original on February 14, 2020. Retrieved October 17, 2019.
^"Table 13. State Population – Rank, Percent Change, and Population Density". U.S. Census Bureau. 2008. Archived from the original (Excel) on September 23, 2015. Retrieved October 24, 2010.
^"Mean Center of Population for the United States: 1790 to 2000" (PDF). U.S. Census Bureau. Archived from the original (PDF) on November 3, 2001. Retrieved October 24, 2010.
^"Annual Estimates of the Resident Population for Incorporated Places over 110,000, Ranked by July 1, 2009 Population: April 1, 2000 to July 1, 2009 (SUB-EST2009-01)". U.S. Census Bureau. Archived from the original on October 18, 2010. Retrieved May 19, 2011.
^"The World Factbook: Puerto Rico". CIA. Retrieved July 1, 2020.
^"The World Factbook: Northern Mariana Islands". CIA. Retrieved July 1, 2020.
^"The World Factbook: American Samoa". CIA. Retrieved July 1, 2020.
^ a b cMary Kekatos (May 24, 2022). "1st increase in births reported in 7 years, CDC finds". ABC News.
^Osterman, Michelle J.K.; Hamilton, Brady E.; Martin, Joyce A.; Driscoll, Anne K.; Valenzuela, Claudia P. (January 31, 2023). "Births: Final Data for 2021" (PDF). National Vital Statistics Reports. 72 (1): 1–53. PMID 36723449.
^ a bBrady E. Hamilton; Michelle J.K. Osterman; Joyce A. Martin (March 2022). "Changes in Births by Month: United States, January 2019–June 2021" (PDF). Centers for Disease Control and Prevention.
^ a b c"Births: Final Data for 2014" (PDF). Centers for Disease Control and Prevention. Retrieved October 3, 2017.
^"National Vital Statistics Reports. Births: Final Data for 2015" (PDF). Centers for Disease Control and Prevention. Retrieved October 3, 2017.
^Perry, Susan (January 11, 2019). "U.S. fertility rate continues to decline, reaching lowest level in 40 years". MinnPost.
^"NVSS - Birth Data". Centers for Disease Control and Prevention. June 14, 2021.
^Camarota, Steven A.; Zeigler, Karen. "The Declining Fertility of Immigrants and Natives" (PDF). Cis.org. Retrieved October 3, 2017.
^"Immigrant and Emigrant Populations". Migration Policy Institute. February 10, 2014. Retrieved July 24, 2023.
^Leonhardt, David (June 12, 2024). "The Force Shaping Western Politics". The New York Times. Archived from the original on June 12, 2024.
^ a b c dRadford, Jynnah (June 17, 2019). "Key findings about U.S. immigrants". Pew Research Center.
^ a bKrogstad, Jens Manuel (October 7, 2019). "Key facts about refugees to the U.S." Pew Research Center.
^"New Population Estimates Show COVID-19 Pandemic Significantly Disrupted Migration Across Borders". Census.gov. Retrieved July 20, 2022.
^"Largest region-of-birth group of immigrants in US" (PDF). U.S. Census Bureau. Archived from the original (PDF) on February 9, 2015. Retrieved October 3, 2017.
^"Introduction: Immigration from Latin America and Caribbean". Harvard University. Archived from the original on February 28, 2019.
^"Table 3. Persons Obtaining Lawful Permanent Resident Status by Region and Country of Birth: Fiscal Years 2018 to 2020". Yearbook of Immigration Statistics. Department of Homeland Security. January 6, 2022. Retrieved February 7, 2021.
^"Frequently Requested Statistics on Immigrants and Immigration in the United States". Migration Policy Institute. March 14, 2019.
^"Table 1. Persons Obtaining Lawful Permanent Resident Status: Fiscal Years 1820 to 2018". Yearbook of Immigration Statistics. Department of Homeland Security. December 19, 2019. Retrieved January 12, 2020.
^"Yearbook 2021 | Homeland Security". www.dhs.gov. Retrieved December 14, 2022.
^"Yearbook 2021 | Homeland Security". www.dhs.gov. Retrieved December 14, 2022.
^"Table 6. Persons Obtaining Lawful Permanent Resident Status by Type and Major Class of Admission: Fiscal Years 2018 to 2020". Yearbook of Immigration Statistics. Department of Homeland Security. December 19, 2019. Retrieved February 7, 2022.
^ a b c d e f g"COVID-19, Declining Birth Rates and International Migration Resulted in Historically Small Population Gains". US Census B.gov. Retrieved February 16, 2022.
^ a b c"Provisional number of marriages and marriage rate, divorces and annulments and rate, 2000–2020" (PDF). Centers for Disease Control and Prevention/NCHS National Vital Statistics System. Archived (PDF) from the original on February 16, 2022. Retrieved February 16, 2022.
^"Marriage rates by State: 1990, 1995, and 1999–2019" (PDF). Centers for Disease Control and Prevention/NCHS, National Vital Statistics System. Archived (PDF) from the original on February 14, 2022. Retrieved February 16, 2022.
^Sullivan, Amy (March 20, 2009). "Behind the Boom in Adult Single Motherhood". Time.com. Archived from the original on March 22, 2009.
^"Blacks rank highest in unwed births". Florida Today. Melbourne, Florida. November 7, 2010. p. 9A. Archived from the original on June 14, 2011. Retrieved November 9, 2010.
^"Births to unmarried women, by race and Hispanic origin of mother: United States, each state and territory, 2020" (PDF). National Vital Statistics Reports. 17 (70). CDC. March 7, 2022. Retrieved February 16, 2022.
^"Birthrate Is Lowest in a Century". The New York Times. Associated Press. August 27, 2010. Retrieved August 28, 2010.
^Kowlessar, N.M.; Jiang, H.J.; Steiner, C. (October 2013). "Hospital Stays for Newborns, 2011". HCUP Statistical Brief (163). Rockville, MD: Agency for Healthcare Research and Quality. PMID 24308074.
^Roan, Shari (March 31, 2011). "Drop in U.S. birth rate is the biggest in 30 years". Los Angeles Times.
^ a b"America's Birth Rate Declined For The Third Year Running". Business Insider. August 12, 2011.
^"Health and Wellness". USA Today.
^"Lower birth rate blamed on the economy". WZZM. February 9, 2013. Archived from the original on February 9, 2013. Retrieved October 3, 2017.
^ a b c d"Teen Birth Rates Declined Again in 2009". Centers for Disease Control and Prevention. June 27, 2019. Archived from the original on July 4, 2011.
^"Teen Birth Rates Drop, But Disparities Persist". Centers for Disease Control and Prevention. March 6, 2020.
^Lahmeyer, Jan (January 22, 2000). "United States of America: historical demographical data of the whole country". Population Statistics. Archived from the original on July 23, 2019. Retrieved October 16, 2013.
^"Data Access – Vital Statistics Online". Centers for Disease Control and Prevention. May 13, 2019.
^1960 to 2011"United States – Death rate: Death rate, crude (per 1,000 people)". Index Mundi. Retrieved October 24, 2013.
^ a bHistorical Statistics of the United States – Colonial Times To 1970 – Part 1 (PDF) (Report) (Bicentennial ed.). U.S. Department of Commerce. Bureau of Census. 1975. pp. 19, 50.
^"National Vital Statistics Reports. Births: Final Data for 2017" (PDF). Centers for Disease Control and Prevention. Retrieved December 27, 2018.
^"Products – Data Briefs – Number 328 – November 2018". Centers for Disease Control and Prevention. June 7, 2019.
^"2019 U.S. Population Estimates Continue to Show the Nation's Growth Is Slowing". U.S. Census Bureau. December 30, 2019. Retrieved December 30, 2019.
^"Mortality in the United States, 2018". Centers for Disease Control and Prevention. January 29, 2020. Retrieved January 30, 2020.
^"COVID-19 Coding and Reporting Guidance – Monthly Birth Counts for Maternal Coronavirus Disease (COVID-19)". Centers for Disease Control and Prevention. March 8, 2021. Retrieved March 13, 2021.
^"Mortality in the United States, 2020" (PDF). NCHS Data Brief (427). CDC. Archived (PDF) from the original on December 22, 2021. Retrieved December 21, 2021.
^"Births: Provisional Data for 2021" (PDF). Retrieved May 24, 2022.
^Ahmad, Farida B. (2022). "Provisional Mortality Data — United States, 2021". MMWR. Morbidity and Mortality Weekly Report. 71 (17): 597–600. doi:10.15585/mmwr.mm7117e1. ISSN 0149-2195. PMC 9098238. PMID 35482572.
^Ahmad, Farida B. (2023). "Provisional Mortality Data — United States, 2022". MMWR. Morbidity and Mortality Weekly Report. 72 (18): 488–492. doi:10.15585/mmwr.mm7218a3. ISSN 0149-2195. PMC 10168603. PMID 37141156.
^Fitzpatrick, Alex; Beheraj, Kavya (October 4, 2023). "The birth rate ticked up in 2022. Can the reversal last?". Axios. Retrieved October 7, 2023.
^"Births: Final Data for 2022" (PDF). CDC>NCHS>National Vital Statistics System. US CDC. Retrieved April 8, 2024.
^"CDC WONDER". CDC WONDER. US CDC. Retrieved April 2, 2024.
^"CDC WONDER". CDC WONDER. US CDC. Retrieved April 2, 2024.
^"Observed and Total Population for the U.S. and the States, 2010-2040".
^"Population Projections". U.S. Census Bureau.
^"Decennial Census by Decades". U.S. Census Bureau. Retrieved April 27, 2021.
^"Chapter Z Colonial and Pre-Federal Statistics" (PDF).
^Resident Population Data. "Resident Population Data – 2010 Census". U.S. Census Bureau. Retrieved February 22, 2013.
^"Historical Census Statistics on Population Totals By Race, 1790 to 1990..." U.S. Census Bureau. Archived from the original on July 25, 2008. Retrieved May 28, 2013.
^Hobbs, Frank; Stoops, Nicole (November 2002). "Census 2000 Special Reports: Demographics Trends in the 20th Century" (PDF). U.S. Census Bureau. Archived from the original (PDF) on January 20, 2012.
^Bennett, Claudette E. (September 1993). "We the Americans: Blacks" (PDF). U.S. Census Bureau. Archived from the original (PDF) on March 26, 2010.
^Saenz, Rogelio (August 2004). "Latinos and the Changing Face of America". Population Reference Bureau. Archived from the original on May 19, 2012.
^Fredrickson, George M. (2005). Foner, Nancy; Fredrickson, George M. (eds.). Not Just Black and White: Historical and Contemporary Perspectives on Immigration, Race, and Ethnicity in the United States. Russell Sage Foundation. p. 120. ISBN 0-87154-270-6.
^Papademetriou, Demetrios G.; Terrazas, Aaron (April 2009). "Immigrants in the United States and the Current Economic Crisis". Migration Policy Institute. Archived from the original on March 4, 2010.
^Segal, Uma A.; Elliott, Doreen; Mayadas, Nazneen S. (2010). Immigration Worldwide: Policies, Practices, and Trends. Oxford University Press US. p. 32. ISBN 978-0-19-538813-8.
^Borjas, George J. (2003). "Welfare reform, labor supply, and health insurance in the immigrant population". Journal of Health Economics. 22 (6): 933–958. CiteSeerX10.1.1.517.7531. doi:10.1016/j.jhealeco.2003.05.002. ISSN 0167-6296. PMID 14604554. S2CID 488620.
^"The First Measured Century: An Illustrated Guide to Trends in America, 1900–2000". Public Broadcasting Service.
^Exner, Rich (July 3, 2012). "Americans under age 1 now mostly minorities, but not in Ohio: Statistical Snapshot". The Plain Dealer. Retrieved July 29, 2012.
^"Non-white births outnumber white births for the first time in US". The Daily Telegraph. May 17, 2012. Archived from the original on May 18, 2012.
^"Median Age Of The Total Population". American FactFinder. Archived from the original on February 12, 2020. Retrieved October 3, 2017.
^ a bHoward, Jacqueline (January 10, 2019). "US fertility rate is below level needed to replace population, study says". CNN.
^Mathews, T.J.; Hamilton, Brady E. (January 10, 2019). "Total Fertility Rates by State and Race and Hispanic Origin: United States, 2017" (PDF). Centers for Disease Control and Prevention.
^Tavernise, Sabrina (June 20, 2018). "Fewer Births Than Deaths Among Whites in Majority of U.S. States". The New York Times.
^ a bPatino, Marie (May 15, 2019). "U.S. Births Fell to Lowest Level in 32 Years in 2018". Bloomberg News.
^"Table A. Apportionment Population, Resident Population, and Overseas Population: 2020 Census and 2010 Census" (PDF).
^ a b cMartin, Joyce A.; Hamilton, Brady E.; Driscoll, Anne K.; Osterman, Michelle J. K.; Valenzuela, Claudia P. (February 7, 2022). "Births: Final Data for 2020" (PDF). National Vital Statistics Reports. 70 (1). CDC: 12. PMID 35157571.
^ a b cWeinstein, Jay; Pillai, Vijayan K. (2016). Demography: The Science of Population (2nd ed.). Rowman & Littlefield. p. 208. ISBN 978-1-442235212.
^ a b c d e"Life expectancy". Our World in Data. Retrieved August 28, 2018.
^except 1918 with only 47 years
^"World Population Prospects – Population Division". United Nations Department of Economic and Social Affairs. Archived from the original on September 19, 2016. Retrieved August 25, 2018.
^ a bHobbs, Frank; Stoops, Nicole (November 2002). "Demographic Trends in the 20th Century. Census 2000 Special Reports" (PDF). U.S. Census Bureau, U.S. Department of Commerce. pp. 56, 77.
^"Feature Article 1: Population by Age and Sex, Australian States and Territories". Australian Bureau of Statistics. December 16, 2011.
^"The 2012 Global Cities Index". A.T. Kearney. Archived from the original on February 15, 2013. Retrieved January 5, 2013.
^"The World According to GaWC – Classification of cities 2010". 2010. Archived from the original on October 10, 2013. Retrieved January 5, 2013.
^"American cities on the rebound". CBS News. August 5, 2011. Retrieved May 8, 2013.
^"Metropolitan and Micropolitan Statistical Areas Population Totals: 2020–2023". United States Census Bureau. May 2023. Retrieved February 14, 2024.
^"P004HISPANIC OR LATINO, AND NOT HISPANIC OR LATINO BY RACE [73] - United States". United States Census Bureau.
^"P2 HISPANIC OR LATINO, AND NOT HISPANIC OR LATINO BY RACE - 2010: DEC Redistricting Data (PL 94-171) - United States". United States Census Bureau.
^"P2 HISPANIC OR LATINO, AND NOT HISPANIC OR LATINO BY RACE - 2020: DEC Redistricting Data (PL 94-171) - United States". United States Census Bureau.
^"Race and Ethnicity in the United States: 2010 Census and 2020 Census". U.S. Census Bureau. Retrieved December 2, 2021.
^Jin, Connie Hanzhang; Talbot, Ruth; Lo Wang, Hansi (August 13, 2021). "What The New Census Data Shows About Race Depends On How You Look At It". NPR.
^ a b"DP05 – ACS Demographic and Housing Estimates". U.S. Census Bureau. Archived from the original on February 14, 2020. Retrieved October 17, 2019.
^"2020 Census Frequently Asked Questions About Race and Ethnicity".
^ a b"2010 Census Demographic Profile Summary File" (PDF). U.S. Census Bureau. Retrieved August 25, 2017.
^"Grid View: Table B02001 - Census Reporter". censusreporter.org. Retrieved June 28, 2024.
^"Grid View: Table B03002 - Census Reporter". censusreporter.org. Retrieved June 28, 2024.
^ a b c d"National Population by Characteristics: 2020-2021". Census.gov. Retrieved June 30, 2022.
^Schaeffer, Katherine (July 30, 2019). "The most common age among whites in U.S. is 58 – more than double that of racial and ethnic minorities". Pew Research Center.
^"ACS Demographic and Housing Estimates – 2011–2015". U.S. Census Bureau. Archived from the original on February 13, 2020. Retrieved August 26, 2017.
^"Grid View: Table B03002 - Census Reporter". censusreporter.org. Retrieved June 29, 2024.
^"American Samoa 2010 Demographic Profile". American FactFinder. Archived from the original on May 3, 2017. Retrieved July 1, 2020.
^"Guam 2010 Demographic Profile". American FactFinder. Archived from the original on April 13, 2016. Retrieved July 1, 2020.
^"Northern Mariana Islands 2010 Demographic Profile". American FactFinder. Archived from the original on November 6, 2018. Retrieved July 1, 2020.
^"The World Factbook: U.S. Virgin Islands". CIA. Retrieved July 1, 2020.
^Cohn, D'Vera (June 26, 2014). "Falloff in births slows shift to a majority-minority youth population". Pew Research Center.
^"About Hispanic Origin". U.S. Census Bureau. Retrieved August 26, 2017.
^"Overview of 2020 AIAN Redistricting Data: 2020" (PDF). Archived from the original (PDF) on January 26, 2022. Retrieved January 16, 2022.
^Bureau, US Census. "A Look at the Largest American Indian and Alaska Native Tribes and Villages in the Nation, Tribal Areas and States". Census.gov. Retrieved June 29, 2024. {{cite web}}: |last= has generic name (help)
^"Grid View: Table B02017 - Census Reporter". censusreporter.org. Retrieved June 29, 2024.
^"Grid View: Table B03002 - Census Reporter". censusreporter.org. Retrieved June 29, 2024.
^"Grid View: Table B02001 - Census Reporter". censusreporter.org. Retrieved June 29, 2024.
^"Federal Register" (PDF). Retrieved September 14, 2016.
^"Grid View: Table B02017 - Census Reporter". censusreporter.org. Retrieved June 29, 2024.
^"Grid View: Table B02019 - Census Reporter". censusreporter.org. Retrieved June 29, 2024.
^"Census profile: United States". Census Reporter. Retrieved June 29, 2024.
^Davenport, Christian (April 20, 2010). "A disconnect at Magruder". The Washington Post. Washington, DC. p. B1.
^Hsu, Spencer S. (May 2, 2010). "Senate Democrats' plan highlights nation's shift to the right on immigration". The Washington Post. Washington, DC. p. A3.
^"How European and U.S. unauthorized immigrant populations compare". Pew Research Center. November 13, 2019. Retrieved January 7, 2020.
^"Grid View: Table B26103 - Census Reporter". censusreporter.org. Retrieved June 29, 2024.
^Bureau, US Census. "2023 National Population Projections Tables: Main Series". Census.gov. Retrieved June 29, 2024. {{cite web}}: |last= has generic name (help)
^"U.S. Hispanic population to triple by 2050". USA Today. February 11, 2008.
^Bureau, US Census. "2023 National Population Projections Tables: Main Series". Census.gov. Retrieved June 29, 2024. {{cite web}}: |last= has generic name (help)
^"Methodology, Assumptions, and Inputs for the 2023 National Population Projections" (PDF). US Census Bureau. July 3, 2024.
^"The Population Estimates "Blended Base:" What it is and Why it Matters". CTData. May 8, 2024. Retrieved July 3, 2024.
^"Grid View: Table B02013 - Census Reporter". censusreporter.org. Retrieved July 4, 2024.
^"Census Bureau discusses new "blended base" methodology for annual Population Estimates - EconSpark". www.aeaweb.org. Retrieved July 4, 2024.
^"Grid View: Table B02001 - Census Reporter". censusreporter.org. Retrieved July 4, 2024.
^Bureau, US Census. "2023 National Population Projections Tables: Main Series". Census.gov. Retrieved June 29, 2024. {{cite web}}: |last= has generic name (help)
^ a b"International Database (IDB)". U.S. Census Bureau. Retrieved June 27, 2022.
^Ohlemacher, Stephen (August 13, 2008). "White Americans no longer a majority by 2042". Associated Press. Archived from the original on August 24, 2008.
^Aizenman, N.C. (August 13, 2008). "U.S. to Grow Grayer, More Diverse". The Washington Post. Retrieved May 8, 2013.
^Passel, Jeffrey (February 11, 2008). "Immigration to Play Lead Role In Future U.S. Growth". Pew Research Center. Archived from the original on January 3, 2010. Retrieved May 8, 2013.
^"The Majority of American Babies Are Now Minorities". Bloomberg. July 25, 2015.
^"Births: Provisional Data for 2021" (PDF). Retrieved July 10, 2022.
^ a b c d"United States Population 2018". World Population Review.
^Passel, Jeffrey S.; Conh, D'Vera (February 11, 2008). "U.S. Population Projections: 2005–2050". Pew Research Center.
^"United Nations, Department of Economic and Social Affairs, Population Division (2019). World Population Prospects 2019". 2019. Retrieved August 21, 2019.
^"Grid View: Table B04007 - Census Reporter". censusreporter.org. Retrieved July 1, 2024.
^"Grid View: Table B04006 - Census Reporter". censusreporter.org. Retrieved June 29, 2024.
^"Grid View: Table B03001 - Census Reporter". censusreporter.org. Retrieved June 29, 2024.
^"Grid View: Table B02018 - Census Reporter". censusreporter.org. Retrieved June 29, 2024.
^"Grid View: Table B02019 - Census Reporter". censusreporter.org. Retrieved June 30, 2024.
^"Grid View: Table B04004 - Census Reporter". censusreporter.org. Retrieved June 30, 2024.
^"Measuring Religion in Pew Research Center's American Trends Panel". Pew Research Center. January 14, 2021. Archived from the original on February 8, 2021. Retrieved February 9, 2021.
^Table No. 68. Religious Bodies – Selected Data (p. 59), "Statistical Abstract of the United States: 2004–2005 (tables 67–69)" (PDF). U.S. Census Bureau.
^"Statistical Abstract of the United States: 2004–2005 (tables 67–69)" (PDF). U.S. Census Bureau.
^"Statistics on Religion in America Report". Pew Forum on Religion & Public Life.
^"America's Changing Religious Landscape". Pew Forum on Religion & Public Life. Pew Research Center's Religion & Public Life Project. May 12, 2015. Retrieved October 9, 2016.
^"In U.S., Decline of Christianity Continues at Rapid Pace". Pew Forum on Religion & Public Life. October 17, 2019. Retrieved October 19, 2019.
^"Global Religious Futures: A Pew-Templeton Project". Pew Research. Archived from the original on May 3, 2013.
^ a b"American Baptist Association – Membership Data". Association of Religion Data Archives. Archived from the original on November 27, 2020. Retrieved August 1, 2019.
^"Summary of Denominational Statistics" (PDF). American Baptist Churches U.S.A. 2017.
^ a b c"AG Churches, Membership, Adherents and Ministers 1960–2018" (PDF). Assemblies of God USA.
^ a b c"Baptist Bible Fellowship International – Membership Data". Association of Religion Data Archives. Archived from the original on September 21, 2020. Retrieved October 28, 2019.
^ a b"Baptist Missionary Association of America – Membership Data". Association of Religion Data Archives. Archived from the original on November 11, 2020. Retrieved August 23, 2019.
^Walton, Jeffrey (August 20, 2019). "Disciples of Christ Claim Distinction of Fastest Declining Church". Juicy Ecumenism. Retrieved November 14, 2019.
^ a b"Church of the Brethren denominational membership falls below 100,000". Church of the Brethren Newsline. January 27, 2021. Retrieved March 9, 2021.
^ a b"Churches Of Christ In The United States – Statistical Summary" (PDF). 21st Century Christian. Archived from the original (PDF) on July 29, 2020. Retrieved October 9, 2019.
^ a b"Table of Statistics of the Episcopal Church From 2018 Parochial Reports" (PDF). Episcopal Church. 2018. Archived from the original (PDF) on September 5, 2019. Retrieved September 9, 2019.
^ a b"ELCA Facts". Evangelical Lutheran Church in America. Archived from the original on September 25, 2016. Retrieved August 16, 2019.
^"About the EPC". Evangelical Presbyterian Church.
^ a b c"Greek Orthodox Archdiocese of America – Membership Data". Association of Religion Data Archives. Archived from the original on April 25, 2021. Retrieved September 17, 2019.
^ a b c"Rosters and Statistics". The Lutheran Church-Missouri Synod. November 2018. Retrieved June 9, 2019.
^ a b c"National Association of Free Will Baptists – Membership Data". Association of Religion Data Archives. Archived from the original on May 5, 2011. Retrieved September 21, 2019.
^ a b c d"Statistics". Baptist World Alliance. Archived from the original on September 27, 2019.
^ a b c"Orthodox Church in America – Membership Data". Association of Religion Data Archives. Archived from the original on November 11, 2020. Retrieved October 17, 2019.
^"PCA Statistics Five Year Summary". PCA Administrative Committee.
^ a b"Comparative Summaries of Statistics 2018" (PDF). Presbyterian Church USA. Retrieved June 3, 2019.
^"Comparative Summaries of Statistics 2020" (PDF). Presbyterian Church USA.
^"Church Statistical Data". Reformed Church in America.
^"Catholics". Adherents.com. Archived from the original on October 3, 2003. Retrieved September 19, 2011.
^"Section 1. Population" (PDF). Statistical Abstract of the United States: 2004–2005. U.S. Census Bureau. p. 55. Retrieved June 29, 2008. (Table No. 67. Self-described religious identification of adult population: 1990 and 2001; data for 2001).
^ a b"Southern Baptist Convention continues statistical decline, Floyd calls for rethinking ACP process". Baptist Press. June 4, 2020. Retrieved June 8, 2020.
^"UMData". umdata.org.
^ a b"2019 WELS Annual Report". Wisconsin Evangelical Lutheran Synod. Retrieved July 23, 2019.
^"By 2040, Islam will be second largest religion in US: Study". Hindustan Times. January 12, 2018.
^ a bKosmin, Barry A.; Keysar, Ariela (2009). "American Religious Identification Survey (ARIS) 2008" (PDF). Trinity College. Hartford, Connecticut, USA. Archived from the original (PDF) on April 7, 2009. Retrieved April 1, 2009.
^ a b c d e"Religion in America: U.S. Religious Data, Demographics and Statistics". Pew Research Center. Retrieved October 19, 2019.
^"2000 Census information on Gay and Lesbian Couples". Gay Demographics.org. Archived from the original on July 1, 2009.
^Gates, Gary J. "Same-sex Couples and the Gay, Lesbian, Bisexual Population: New Estimates from the American Community Survey" (PDF). UCLA. Retrieved March 4, 2024.
^Gates, Gary J. (October 2006). "Same-sex Couples and the Gay, Lesbian, Bisexual Population: New Estimates from the American Community Survey" (PDF). The Williams Institute on Sexual Orientation Law and Public Policy, UCLA School of Law. Archived from the original (PDF) on July 2, 2007. Retrieved April 20, 2007.
^Gates, Gary. "How many people are lesbian, gay, bisexual, and transgender?" (PDF). The Williams Institute, UCLA School of Law. Retrieved February 24, 2019.
^"Research 4M adults in US identify as gay". Florida Today. Melbourne, Florida. March 1, 2011. p. 1A.
^ a b"Place Of Birth For The Foreign-Born Population In The United States. Universe: Foreign-born population excluding population born at sea more information. 2017 American Community Survey 1-Year Estimates". United States Census Bureau. Archived from the original on February 14, 2020. Retrieved August 6, 2019.
^Alperin, Elijah; Batalova, Jeanne (August 1, 2018). "European Immigrants in the United States – Immigration Pathways and Naturalization". Migration Policy Institute.
^"How Are We Counted?". American Citizens Abroad. April 2017. Retrieved September 22, 2019. The Federal Voting Assistance Program (FVAP) estimates that there are 4.5 million to 6.5 million overseas Americans while the State Department's most recent calculation (April 2015) of US citizens living overseas is 8.7 million{...}US citizens living outside the US who are not employed by the US Government, including dependents living with them – Not counted in the census.
^Smith, Claire M. "These are our Numbers: Civilian Americans Overseas and Voter Turnout" (PDF). Overseas Vote Foundation. Archived from the original (PDF) on October 24, 2013. (Originally published in OVF Research Newsletter, vol. 2, issue 4, August 2010).
^Trow, Steve; Bruce, Charles (March 26, 2007). "U.S. Citizens Who Don't Know It" (PDF). Legal Times. 30 (13). Archived from the original (PDF) on February 25, 2021. Retrieved November 3, 2014.
^Jaylinn Herrera (November 12, 2022). "More Americans are living and working in Mexico. Where does that leave the locals?". NBC News website.
^"Income and Poverty in the United States: 2020". Census.gov. Retrieved June 29, 2022.
^Semega, Jessica; Chen, Frances; Kollar, Melissa; Shrider, Emily A. "Income and Poverty in the United States: 2021" (PDF). US CENSUS BUREAU. Retrieved September 19, 2022.
^"Personal Income: PINC-03". US CENSUS BUREAU. Retrieved June 29, 2022.
^"Historical Income Tables: Households". US CENSUS BUREAU. Retrieved June 29, 2022.
^ a b"S1501 – Educational Attainment". U.S. Census Bureau. Archived from the original on January 22, 2019. Retrieved October 17, 2019.
^ a b c d e f"DP03 – Selected Economic Characteristics". U.S. Census Bureau. Archived from the original on February 14, 2020. Retrieved October 17, 2019.
^"Current Unemployment Rates for States and Historical Highs/Lows". U.S. Bureau of Labor Statistics.
^ a b c"Seasonally Adjusted Unemployment Rate". U.S. Dept. of Labor. Retrieved September 19, 2016.
^"Employment Situation Summary". U.S. Dept. of Labor. July 2, 2015. Retrieved December 26, 2015.
^"Table A-15. Alternative measures of labor underutilization". U.S. Bureau of Labor. Retrieved November 13, 2011.
^Rickard, Stephanie J. (2020). "Economic Geography, Politics, and Policy". Annual Review of Political Science. 23: 187–202. doi:10.1146/annurev-polisci-050718-033649.
^Schuman, H. and Scott, J. (1989), Generations and collective memories, American Sociological Review, vol. 54, 1989, pp. 359–81.
^Deane, Claudia (December 15, 2016). "Americans Name the 10 Most Significant Historic Events of Their Lifetimes". Pew Research Center. Retrieved April 12, 2019.
^ a b c d eDimock, Michael (January 17, 2019). "Defining generations: Where Millennials end and Generation Z begins". Pew Research Center. Retrieved April 12, 2019.
^"People: The Younger Generation". Time.com. November 5, 1951. Archived from the original on September 13, 2012.
^Miller, Jon D. "The Generation X Report: Active, Balanced, and Happy: These Young Americans are not bowling alone" (PDF). University of Michigan, Longitudinal Study of American Youth, funded by the National Science Foundation. Retrieved October 30, 2012.
^Jackson, Ronald L. II, ed. (2010). Encyclopedia of Identity, Volume 1. Sage Publications. p. 307. ISBN 978-1-4129-5153-1.
^"Baby Boomers - Year Range, Definition & Facts". June 7, 2019.
^Tuttle, William M. (1993). "Daddy's Gone to War": The Second World War in the Lives of America's Children. Oxford University Press. p. 25. ISBN 978-0-195096491. Retrieved March 17, 2014.
^"Census Bureau Releases 2021 CPS ASEC Geographic Mobility Data". U.S. Census Bureau. Retrieved March 3, 2022.
External links
Wikimedia Commons has media related to Demographics of the United States.


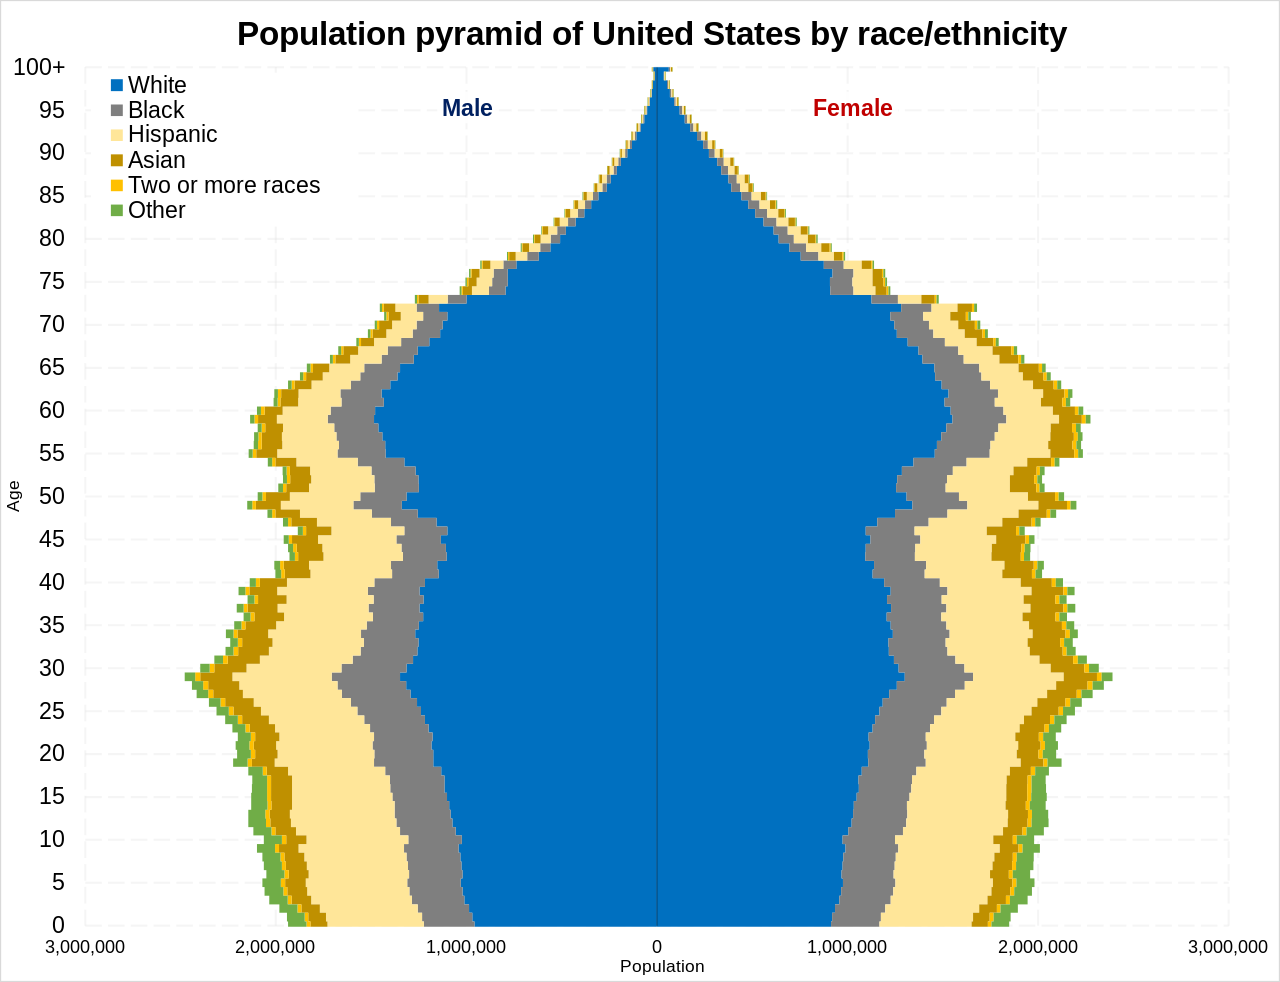


![States in the United States by Catholic population according to the Pew Research Center 2014 Religious Landscape Survey.[242] States with Catholic population greater than the United States as a whole are in full red.](http://upload.wikimedia.org/wikipedia/commons/thumb/c/ca/US_states_by_Catholic_population.png/1280px-US_states_by_Catholic_population.png)
![States in the United States by Evangelical Protestant population according to the Pew Research Center 2014 Religious Landscape Survey.[242] States with Evangelical Protestant populations greater than the United States as a whole are in full orange.](http://upload.wikimedia.org/wikipedia/commons/thumb/7/7d/US_states_by_Evangelical_Protestant_population.png/1280px-US_states_by_Evangelical_Protestant_population.png)
![States in the United States by Mainline or Black Protestant population according to the Pew Research Center 2014 Religious Landscape Survey.[242] States with Mainline or Black Protestant population greater than the United States as a whole are in full purple.](http://upload.wikimedia.org/wikipedia/commons/thumb/f/f6/US_states_by_Mainline_or_Black_Protestant_population.png/1280px-US_states_by_Mainline_or_Black_Protestant_population.png)
![States in the United States by non-Christian (e.g. Non-religious, Jewish, Muslim, Hindu, Buddhist) population according to the Pew Research Center 2014 Religious Landscape Survey.[242] States with non-Christian populations greater than the United States as a whole are in full blue.](http://upload.wikimedia.org/wikipedia/commons/thumb/5/53/US_states_by_non-Christian_population.png/1280px-US_states_by_non-Christian_population.png)
![States in the United States by non-Protestant and non-Catholic Christian (e.g. Mormon, Jehovah's Witness, Eastern Orthodox) population according to the Pew Research Center 2014 Religious Landscape Survey.[242] States with non-Catholic/non-Protestant Christian population greater than the United States as a whole are in full green.](http://upload.wikimedia.org/wikipedia/commons/thumb/5/55/US_states_by_other_Christian_population.png/1280px-US_states_by_other_Christian_population.png)
![Counties in the United States by the percentage of the over 25-year-old population with bachelor's degrees according to the U.S. Census Bureau American Community Survey 2013–2017 5-Year Estimates.[258] Counties with higher percentages of bachelor's degrees than the United States as a whole are in full orange.](http://upload.wikimedia.org/wikipedia/commons/thumb/1/18/US_counties_by_percentage_BAs.png/1280px-US_counties_by_percentage_BAs.png)
![States in the United States by the percentage of the over 25-year-old population with bachelor's degrees according to the U.S. Census Bureau American Community Survey 2013–2017 5-Year Estimates.[258] States with higher percentages of bachelor's degrees than the United States as a whole are in full orange.](http://upload.wikimedia.org/wikipedia/commons/thumb/5/5b/US_states_by_percentage_BAs.png/1280px-US_states_by_percentage_BAs.png)
![Counties in the United States by per capita income according to the U.S. Census Bureau American Community Survey 2013–2017 5-Year Estimates.[259] Counties with per capita incomes higher than the United States as a whole are in full green.](http://upload.wikimedia.org/wikipedia/commons/thumb/7/7e/US_counties_by_per_capita_income.png/1280px-US_counties_by_per_capita_income.png)
![States in the United States by per capita income according to the U.S. Census Bureau American Community Survey 2013–2017 5-Year Estimates.[259] States with per capita incomes higher than the United States as a whole are in full green.](http://upload.wikimedia.org/wikipedia/commons/thumb/1/18/US_states_by_per_capita_income.png/1280px-US_states_by_per_capita_income.png)
![Counties in the United States by median nonfamily household income according to the U.S. Census Bureau American Community Survey 2013–2017 5-Year Estimates.[259] Counties with median nonfamily household incomes higher than the United States as a whole are in full green.](http://upload.wikimedia.org/wikipedia/commons/thumb/5/50/US_counties_by_median_nonfamily_income.png/1280px-US_counties_by_median_nonfamily_income.png)
![States in the United States by median nonfamily household income according to the U.S. Census Bureau American Community Survey 2013–2017 5-Year Estimates.[259] States with median nonfamily household incomes higher than the United States as a whole are in full green.](http://upload.wikimedia.org/wikipedia/commons/thumb/b/b3/US_states_by_median_nonfamily_income.png/1280px-US_states_by_median_nonfamily_income.png)
![Counties in the United States by median family household income according to the U.S. Census Bureau American Community Survey 2013–2017 5-Year Estimates.[259] Counties with median family household incomes higher than the United States as a whole are in full green.](http://upload.wikimedia.org/wikipedia/commons/thumb/4/4c/US_counties_by_median_family_income.png/1280px-US_counties_by_median_family_income.png)
![States in the United States by median family household income according to the U.S. Census Bureau American Community Survey 2013–2017 5-Year Estimates.[259] States with median family household incomes higher than the United States as a whole are in full green.](http://upload.wikimedia.org/wikipedia/commons/thumb/f/fb/US_states_by_median_family_income.png/1280px-US_states_by_median_family_income.png)
