- Claudius Ptolemy 1482
- Cantino c. 1502 (Padrão Real)
- Waldseemüller 1508
- Pietro Coppo 1520
- D. Ribeiro 1529 (Padrón Real)
- Oronce Fine 1531
- Oronce Fine 1536
 Mercator 1538
- Jean Rotz 1542
- Giacomo Gastaldi 1548
- Ortelius 1570[23]

The Mercator world map of 1569 is titled Nova et Aucta Orbis Terrae Descriptio ad Usum Navigantium Emendate Accommodata (Renaissance Latin for "New and more complete representation of the terrestrial globe properly adapted for use in navigation"). The title shows that Gerardus Mercator aimed to present contemporary knowledge of the geography of the world and at the same time 'correct' the chart to be more useful to sailors. This 'correction', whereby constant bearing sailing courses on the sphere (rhumb lines) are mapped to straight lines on the plane map, characterizes the Mercator projection. While the map's geography has been superseded by modern knowledge, its projection proved to be one of the most significant advances in the history of cartography, inspiring the 19th century map historian Adolf Nordenskiöld to write "The master of Rupelmonde stands unsurpassed in the history of cartography since the time of Ptolemy."[2] The projection heralded a new era in the evolution of navigation maps and charts and it is still their basis.

The map is inscribed with a great deal of text. The framed map legends (or cartouches) cover a wide variety of topics: a dedication to his patron and a copyright statement; discussions of rhumb lines; great circles and distances; comments on some of the major rivers; accounts of fictitious geography of the north pole and the southern continent. The full Latin texts and English translations of all the legends are given below. Other minor texts are sprinkled about the map. They cover such topics as the magnetic poles, the prime meridian, navigational features, minor geographical details, the voyages of discovery and myths of giants and cannibals. These minor texts are also given below.
A comparison with world maps before 1569 shows how closely Mercator drew on the work of other cartographers and his own previous works, but he declares (Legend 3) that he was also greatly indebted to many new charts prepared by Portuguese and Spanish sailors in the portolan tradition. Earlier cartographers of world maps had largely ignored the more accurate practical charts of sailors, and vice versa, but the age of discovery, from the closing decade of the fifteenth century, stimulated the integration of these two mapping traditions: Mercator's world map is one of the earliest fruits of this merger.
Mercator's 1569 map was a large planisphere,[3] i.e. a projection of the spherical Earth onto the plane. It was printed in eighteen separate sheets from copper plates engraved by Mercator himself.[4] Each sheet measures 33×40 cm and, with a border of 2 cm, the complete map measures 202×124 cm. All sheets span a longitude of 60 degrees; the first row of 6 sheets cover latitudes 80°N to 56°N, the second row cover 56°N to 16°S and the third row cover 16°S to 66°S: this latitude division is not symmetric with respect to the equator thus giving rise to the later criticism of a Euro-centric projection.[5]
It is not known how many copies of the map were printed, but it was certainly several hundred.[6] Despite this large print run, by the middle of the nineteenth century there was only one known copy, that at the Bibliothèque Nationale de France. A second copy was discovered in 1889 at the Stadt Bibliothek of Breslau[7] along with maps of Europe and Britain.[citation needed]These three maps were destroyed by fire in 1945 but fortunately copies had been made before then.[8]A third copy was found in a map collection Mappae Geographiae vetustae from the archives of the Amerbach family which had been given to the library of the University of Basel.[9]The only other complete copy was discovered at an auction sale in Luzern in 1932 and is now in the map collection of the Maritiem Museum Rotterdam.[10][11] In addition to the complete copies there is a single page showing the North Atlantic in the Mercator atlas of Europe in the British Library.[12] Many paper reproductions of all four maps have been made. Those at full scale, providing access to the detail and the artistry of Mercator's engraving, are listed next. Images of the Basil, Paris, and Rotterdam impressions can be found online.
The Basel map is the cleanest of the three extant versions. It is called the 'three strip' version because it is in three separate rows rather than a single assembled sheet. It was photographically reproduced at a reduced scale by Wilhelm Kruecken in 1992; more recently (2011) he has produced a full-scale and full sized (202×124 cm) reproduction of the map along with a five volume account (in German) covering all aspects of Mercator's work.[13]Medium resolution scans of the separate sheets and a composite of all 18 scans are accessible as follows.
The Paris copy is a single combined sheet that came into the possession of the Bibliothèque Nationale from the estate of Julius Klaproth (1783–1835).[9] The map is uncoloured, partially borderless and in poor condition due to repeated exhibitions during the nineteenth century.[9] It was reproduced by Edmé-François Jomard (1777–1862) between 1842 and 1862 as part of a collection of 21 facsimile maps. Very few copies of this facsimile are known.
The Bibliothèque Nationale has put a digital image of their copy into the public domain in the form of 13 separate images.[14] The images do not correspond exactly with the 18 original sheets: they are in three rows of different heights with 5, 4, 4 images respectively. The zoomable images permit examination of small sections of the map in very great detail. These are the only online images at a high enough resolution to read the smallest text.
Immediately after its discovery in 1889 the Breslau map was described by Heyer[8] who initiated copies (in multiple sheets) for the Berlin Geographical Society in 1891.[15] Forty years later, in 1931, a further 150 copies were issued by the Hydrographic Bureau
This copy in the Maritiem Museum Rotterdam is in the form of an atlas[16] constructed by Mercator for his friend and patron Werner von Gymnich.[17] It was made by Mercator in (or shortly after) 1569 by dissecting and reassembling three copies of his original wall map to create coherent units such as continents or oceans or groups of legends.[18] There are 17 non-blank coloured pages which may be viewed online (and zoomed to a medium resolution, much lower than that of the French copy at the Bibliothèque Nationale).[19]
In 1962 a monochrome facsimile of this atlas was produced jointly by the curators of the Rotterdam museum and the cartographic journal Imago Mundi.[20] The plates are accompanied with comprehensive bibliographic material, a commentary by van 't Hoff and English translations of the Latin text from the Hydrographics Review.[21] More recently, in 2012, the Maritiem Museum Rotterdam produced a facsimile edition of the atlas, with an introduction by Sjoerd de Meer.[22]

![Ortelius 1570[23]](http://upload.wikimedia.org/wikipedia/commons/thumb/6/6f/OrteliusWorldMap.jpeg/1280px-OrteliusWorldMap.jpeg)
._HM_46._PORTOLAN_ATLAS_and_NAUTICAL_ALMANAC._France,_1543.jpg/1280px-Guillaume_Brouscon._World_chart,_which_includes_America_and_a_large_Terra_Java_(Australia)._HM_46._PORTOLAN_ATLAS_and_NAUTICAL_ALMANAC._France,_1543.jpg)
In Legend 3 Mercator states that his first priority is "to spread on a plane the surface of the sphere in such a way that the positions of places shall correspond on all sides with each other, both in so far as true direction and distance are concerned and as correct longitudes and latitudes". He goes on to point out the deficiencies of previous projections,[24] particularly the distortion caused by the oblique incidence of parallels and meridians which gives rise to incorrect angles and shapes: therefore he adopts parallel meridians and orthogonal parallels. This is also a feature of sixteenth-century plane charts (equirectangular projections) but they also have equally spaced parallels; in Legend 3 Mercator also emphasizes the distortion that this gives rise to. In particular, the straight lines emanating from the compass roses are not rhumb lines so that they do not give a true bearing. Nor was it straightforward to calculate the sailing distances on these charts. Mariners were aware of these problems and had evolved rules of thumb[citation needed] to enhance the accuracy of their navigation.
Mercator presents his remedy for these problems: "We have progressively increased the degrees of latitude towards each pole in proportion to the lengthenings of the parallels with reference to the equator." The resulting variation of the latitude scale is shown on the meridian at 350°E of his map. Later, Edward Wright and others showed how this statement of Mercator could be turned into a precise mathematical problem whose solution permitted the calculation of the latitude scale, but their methods had not been developed at the time of Mercator.[25]All these methods hinge on the observation that the circumference of a parallel of latitude is proportional to the cosine of the latitude, which is unity at the equator and zero at the poles. The length of a parallel, and hence the spacing of the parallels, must therefore be increased by a factor equal to the reciprocal of the cosine (i.e. the secant) of the latitude.
Mercator left no explanation of his own methods but, as long ago as 1541, he had demonstrated that he understood how to draw rhumb lines on a globe.[26]It has been suggested that he drew the rhumbs by using a set of metal templates for the seven principal compass points within each quadrant, as follows.[citation needed] Starting at the equator draw a short straight line segment, at say 67.5° (east by northeast). Continue as far as a meridian separated by only two or three degrees of longitude and mark the crossing point. Move the template to that point and repeat the process. Since the meridians have converged a little the line will bend up a little generating a rhumb which describes a spiral on the sphere. The latitude and longitude of selected points on the rhumb could have then been transferred to the chart and the latitude scale of the chart adjusted so that the rhumb becomes a straight line. There has been no shortage of proposed methods for the construction. For example, Hollander analyzed fourteen such hypotheses and concluded that Mercator may have used a judicious mix of mechanical transference and numerical interpolations.[27] However he proceeded, Mercator achieved a fairly accurate, but not perfect, latitude scale.[28]
Since the parallels shrink to zero length as they approach the pole they have to be stretched by larger and larger amounts. Correspondingly the parallel spacing must increase by the same ratio. Mercator concludes that "The chart cannot be extended as far as the pole, for the degrees of latitude would finally attain infinity." —Legend 6. (That is, the reciprocal of the cosine of the latitude become infinite). He therefore uses a completely different projection for the inset map of the north polar regions: an azimuthal equidistant projection.
It took many years for Mercator's projection to gain wider acceptance. The following gallery shows the first maps in which it was employed. General acceptance only came with the publication of the French sea atlas "Le Neptune Francois"[citation needed] at the end of the seventeenth century: all the maps in this widely disseminated volume were on the Mercator projection.[29]
In Legend 12 Mercator makes careful distinction between great circles (plaga) and rhumb lines (directio) and he points out that the rhumb between two given points is always longer than the great circle distance, the latter being the shortest distance between the points. However, he stresses that over short distances (which he quantifies) the difference may be negligible and a calculation of the rhumb distance may be adequate and more relevant since it is the sailing distance on a constant bearing. He gives the details of such a calculation in a rather cumbersome fashion in Legend 12 but in Legend 10 he says that the same method can be applied more readily with the Organum Directorium (the Diagram of Courses, sheet 18) shown annotated here. Only dividers were used in these constructions but the original maps had a thread attached at the origin of each compass rose. Its use is partially explained in Legend 10.

To illustrate his method take A at (20°N,33°E) and B at (65°N,75°E). Plot the latitude of A on the left hand scale and plot B with the appropriate relative latitude and longitude. Measure the azimuth α, the angle MAB: it can be read off the compass scale by constructing OP parallel to AB; for this example it is 34°. Draw a line OQ through the origin of the compass rose such that the angle between OQ and the equator is equal to the azimuth angle α. Now find the point N on the equator which is such that the number of equatorial degrees in ON is numerically equal to the latitude difference (45° for AM on the unequal scale). Draw the perpendicular through N and let it meet OQ at D. Find the point E such that OE=OD, here approximately 54°. This is a measure of the rhumb line distance between the points on the sphere corresponding to A and B on the spherical Earth. Since each degree on the equator corresponds to 60 nautical miles the sailing distance is 3,240 nautical miles for this example. If B is in the second quadrant with respect to A then the upper rose is used and if B is west of A then the longitude separation is simply reversed. Mercator also gives a refined method which is useful for small azimuths.
The above method is explained in Legend 12 by using compass roses on the equator and it is only in Legend 10 that he introduces the Organum Directorium and also addresses the inverse problems: given the initial point and the direction and distance of the second find the latitude and longitude of the second.
Mercator's construction is simply an evaluation of the rhumb line distance in terms of the latitude difference and the azimuth as[30]
If the latitude difference is expressed in arc minutes then the distance is in nautical miles.
In later life Mercator commented that the principles of his map had not been understood by mariners but he admitted to his friend and biographer, Walter Ghym, that the map lacked a sufficiently clear detailed explanation of its use.[31] The intention expressed in the last sentence of Legend 10, that he would give more information in a future 'Geographia', was never realized.

In Legend 5 Mercator argues that the Prime Meridian should be identified with that on which the magnetic declination is zero, namely the meridian through the Cape Verde islands, or alternatively that through the island of Corvo in the Azores. (He cites the varying opinions of the Dieppe mariners). The prime meridian is labelled as 360 and the remainder are labelled every ten degrees eastwards. He further claims that he has used information on the geographical variation of declination to calculate the position of the (single) magnetic pole corresponding to the two possible prime meridians: they are shown on Sheet6 with appropriate text. (For good measure he repeats one of these poles on Sheet 1 to emphasize the overlap of the right and left edges of his map; see text). He does not show a position for a south magnetic pole. The model of the Earth as a magnetic dipole did not arise until the end of the seventeenth century,[citation needed] so between AD 1500 and that era the number of magnetic poles was a matter for speculation, variously 1, 2 or 4.[32] Later, he accepted that magnetic declination changed in time, thus invalidating his position that the prime meridian could be chosen on these grounds.
In his introduction to the Imago Mundi facsimile edition t' Hoff gives lists of world maps and regional maps that Mercator may well have seen, or even possessed by the 1560s.[33]A more complete illustrated list of world maps of that time may be compiled from the comprehensive survey of Shirley. Comparisons with his own map show how freely he borrowed from these maps and from his own 1538 world map[34] and his 1541 globe.[citation needed]
.jpg/1280px-Eastern_Mediterranean_and_Aegean_Sea._Battista_Agnese,_PORTOLAN_ATLAS_(Italy_ca._1550).jpg)
In addition to published maps and manuscripts Mercator declares (Legend 3) that he was greatly indebted to many new charts prepared by Portuguese and Spanish sailors in the portolan traditions. "It is from an equitable conciliation of all these documents that the dimensions and situations of the land are given here as accurately as possible." Earlier cartographers of world maps had largely ignored the more accurate practical charts of sailors, and vice versa, but the age of discovery, from the closing decades of the fifteenth century, brought together these two traditions in the person of Mercator.[35]
There are great discrepancies with the modern atlas. Europe, the coast of Africa and the eastern coast of the Americas are relatively well covered but beyond that the anomalies increase with distance. For example, the spectacular bulge on the western coast of South America adapted from Ruscelli's 1561 Orbis Descriptio replaced the more accurate representation of earlier maps. That mistake disappears for good with the Blaeu map of 1606.[36]
The Mediterranean basin shows errors similar to those found in contemporary maps. For example, the latitude of the Black Sea is several degrees too high, like in the maps made by Diogo Ribeiro in Seville in the 1520s.[37] However, in Mercator's map the longitude of the entire basin is exaggerated by about 25%, contrary to the very accurate shape depicted by Ribeiro.[38]

The phantom islands of Frisland and Brasil in the North Atlantic persist in the maps of the period even though they were in waters readily accessed by European sailors. He does show a Strait of Anian between Asia and the Americas as well as NW and NE passages to the spice islands of the East: this he justifies on his studies of the ancient texts detailed in Legend 3 for as yet these were unexplored regions.

The bizarre representation of the geography of the north polar regions in the inset is discussed in detail in Legend 6 and in the minor texts of sheet 13. Mercator uses as his reference a fourteenth-century English friar and mathematician who used an astrolabe to survey the septentrional regions. The four channels carry the sea towards the pole where it disappears into an abyss with great force.
Mercator accepted current beliefs in the existence of a large Southern continent (Terra Australis) — beliefs which would prevail until the discovery of the open seas south of Cape Horn and the circumnavigation of Australia.[39] His biographer, Walter Ghim, explained that even though Mercator was not ignorant that the Austral continent still lay hidden and unknown, he believed it could be "demonstrated and proved by solid reasons and arguments to yield in its geometric proportions, size and weight, and importance to neither of the other two, nor possibly to be lesser or smaller, otherwise the constitution of the world could not hold together at its centre".[40]
Beyond Europe the interiors of the continents were unknown but Mercator struggled to combine the scattered data at his disposal into a harmonious whole in the map legends which speculate on the Asian Prester John and the courses of the Ganges, Nile and Niger. For his geographical information Mercator quotes (Legends 3, 4, 8, 11, 14) classic authors such as Pliny the Elder, Pomponius Mela, Ptolemy, and earlier travellers such as Marco Polo but, as the principal geographer of his time, he would have undoubtedly have been in touch with contemporary travellers.
Mercator was not a navigator himself and, while he was obviously aware of the concept of rhumb line, he missed several key practical aspects of navigation. As a result, his world map "was useless for navigation at the time it was created because navigation was something very different from his idealized concept".[37]
Mercator had to work from the geographic information contained in his source maps, which of course was not always accurate, but he may have also introduced errors of his own by misinterpreting the mathematical structure of the Portuguese and Spanish charts of his time. In addition, even if his sources had been perfect, Mercator's map would have still been of little practical use for navigators due to lack of reliable data on magnetic declination and to the difficulty of determining longitude accurately at sea.[37]
These technical reasons explain why Mercator's projection was not widely adopted for marine charts until the 18th century.[37]
The ornate border of the map shows the 32 points of the compass. The cardinal appoints appear in various forms: west is Zephyrus, Occides, West, Ponente, Oeste; east is Subsola, Oriens, Oost, Levante, Este; south is Auster, Meridio, Zuya Ostre, Sid; north is Boreas, Septentrio, Nord, tramontana. All of the other 28 points are written only in Dutch, confirming Mercator's wish that his map would be put to practical use by mariners.
Within the map Mercator embellishes the open seas with fleets of ships, sea creatures, of which one is a dolphin, and a striking god-like figure which may be Triton. The unknown continental interiors are remarkably devoid of creatures and Mercator is for the most part content to create speculative mountain ranges, rivers and cities. The only land animal, in South America, is shown as "... having under the belly a receptacle in which it keeps its young warm and takes them out but to suckle them." ((40°S,295°E) with text.) He also shows cannibals but this may have been true. The giants shown in Patagonia may also be founded in truth: the reaction of Spanish sailors of slight stature on confronting a tribe of natives who were well over six foot in height. These images of South Americans are almost direct copies of similar figures on the #World and regional maps before 1569 map of Diego Gutierrez.[41]There are three other images of figures: Prester John in Ethiopia (10°N,60°E); a tiny vignette of two 'flute' players (72°N,170°E) (see text); the Zolotaia baba at (60°N,110°E). (Zolotaia baba also may be found on the Mercator map of the North Pole near the right border at mid-height).
The italic script used on the map was largely developed by Mercator himself. He was a great advocate of its use, insisting that it was much clearer than any other. He published an influential book, Literarum latinorum, showing how the italic hand should be executed.[42]
The following literal translations are taken, with permission of the International Hydrographics Board, from the Hydrographic Review.[21] The Latin text differs from that of Mercator in using modern spelling. Punctuation has been modified or added. Paragraph breaks have been added where required.
{{citation}}: CS1 maint: location missing publisher (link).{{citation}}: CS1 maint: multiple names: authors list (link){{citation}}: CS1 maint: location missing publisher (link){{citation}}: |first= has generic name (help).This bibliography gives lists of world and regional maps, on various projections, that Mercator may have used in the preparation of his world map. In addition there are examples of maps of the succeeding decades which did or did not use the Mercator projection. Where possible references are given to printed or online reproductions.
{{citation}}: CS1 maint: location missing publisher (link){{citation}}: CS1 maint: postscript (link)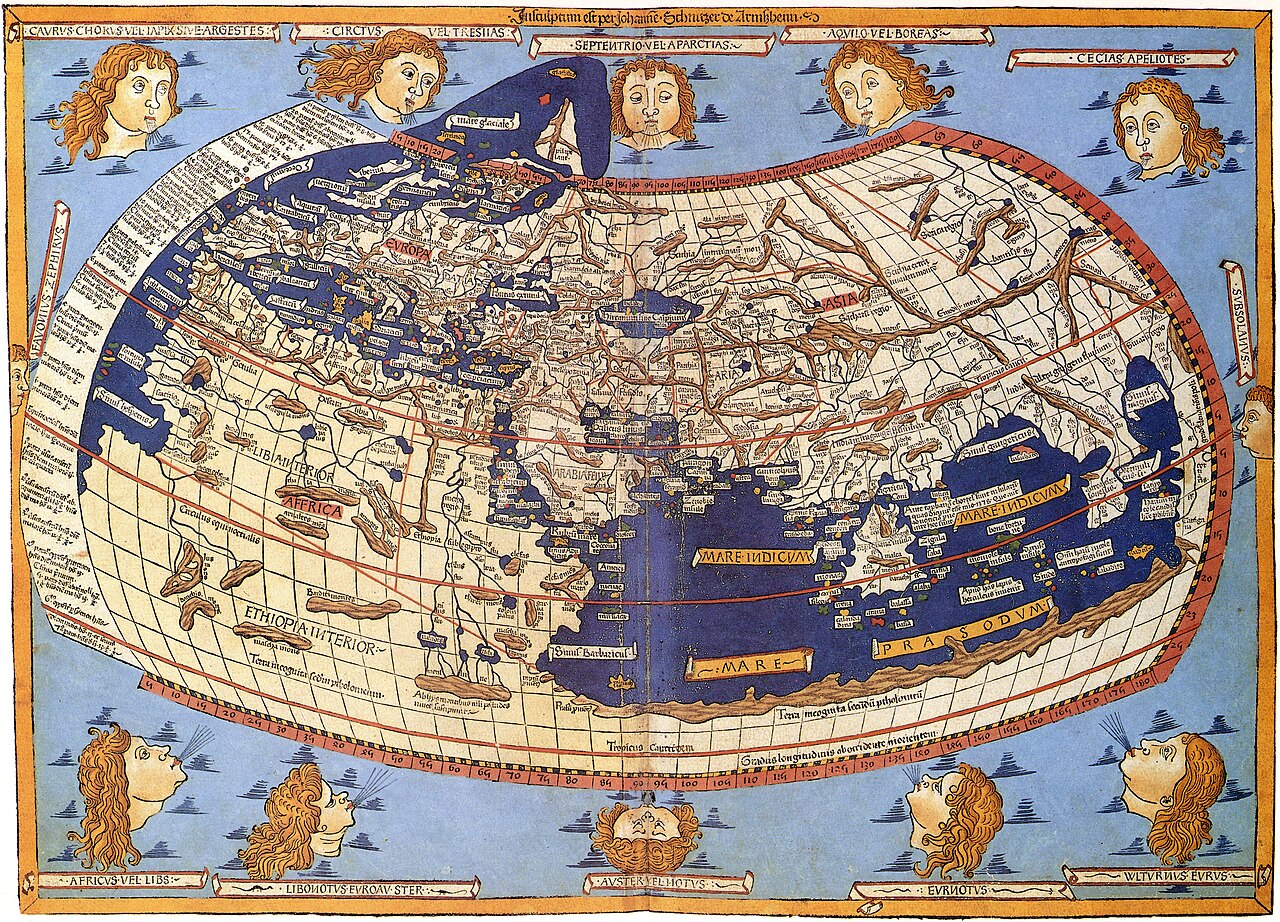
.jpg/1280px-Cantino_planisphere_(1502).jpg)


_007.jpg)