

La demografía de Japón incluye las tasas de natalidad y mortalidad, la distribución por edades , la densidad de población , la etnia , el nivel educativo , el sistema de atención sanitaria de la población , el estatus económico, las afiliaciones religiosas y otros aspectos relacionados con la población japonesa. Según las Naciones Unidas , la población de Japón era de aproximadamente 126,4 millones de personas (a enero de 2020), y alcanzó un máximo de 128,5 millones de personas en 2010. Es el sexto país más poblado de Asia y el undécimo país más poblado del mundo.
En 2023, se prevé que la edad media de los japoneses sea de 49,5 años, el nivel más alto desde 1950, en comparación con los 29,5 de la India, los 38,8 de los Estados Unidos y los 39,8 de China. Japón tiene la segunda mediana de edad más alta del mundo (solo detrás de Mónaco ). Una mejor calidad de vida y controles sanitarios periódicos son solo dos de las razones por las que Japón tiene una de las mayores esperanzas de vida del mundo.
La esperanza de vida al nacer en Japón mejoró significativamente después de la Segunda Guerra Mundial , aumentando 20 años en la década entre 1945 y 1955. A medida que la esperanza de vida aumente aún más, Japón espera experimentar dificultades para cuidar a las generaciones mayores en el futuro. La escasez en el sector de servicios ya es una preocupación importante, con una demanda creciente de enfermeras y trabajadores de la salud.
La tasa de fecundidad entre las mujeres japonesas fue de alrededor de 1,4 hijos por mujer entre 2010 y 2018. Desde entonces y hasta 2022, la tasa de fecundidad siguió disminuyendo hasta 1,2. Aparte de un pequeño baby boom a principios de la década de 1970, la tasa bruta de natalidad en Japón ha estado disminuyendo desde 1950; alcanzó su punto más bajo actual de 5,8 nacimientos por cada mil personas en 2023. Con una tasa de natalidad en descenso y una gran proporción de sus habitantes llegando a la vejez, se espera que la población total de Japón siga disminuyendo, una tendencia que se ha observado desde 2010.
El japonés es una de las principales lenguas de la familia de las lenguas japonesas habladas por los japoneses , que se divide en varios dialectos, de los cuales el dialecto de Tokio se considera japonés estándar. Tiene alrededor de 128 millones de hablantes en total, principalmente en Japón, el único país donde es el idioma nacional , y dentro de la diáspora japonesa en todo el mundo.
La proporción de sexos en Japón en 2021 fue de 95,38 hombres por cada 100 mujeres. Hay 61,53 millones de hombres y 64,52 millones de mujeres en Japón. El porcentaje de población femenina es del 51,18%, en comparación con el 48,82% de población masculina. Japón tiene 2,98 millones más de mujeres que de hombres.
En 2017, Japón era el undécimo país más poblado del mundo . La población total había disminuido un 0,8 por ciento desde el censo de hace cinco años, la primera vez que había disminuido desde el censo de 1945. [5]
Desde 2010, Japón ha experimentado una pérdida neta de población debido a la caída de las tasas de natalidad y la inmigración mínima , a pesar de tener una de las esperanzas de vida más altas del mundo, con 85,00 años en 2016 [update](se situaba en 81,25 en 2006). [6] Utilizando la estimación anual de octubre de cada año, la población alcanzó su punto máximo en 2008 con 128.083.960 y había disminuido en 2.983.352 en octubre de 2021. [7]
Según datos de 2012 del Instituto Nacional de Investigación de Población y Seguridad Social, la población de Japón seguirá disminuyendo en aproximadamente un millón de personas cada año en las próximas décadas, lo que la dejaría con una población de alrededor de 70 millones para 2060 y 42 millones a principios del siglo XXII si las proyecciones actuales no cambian. [8] Se espera que más del 40% de la población tenga más de 65 años en 2060. [9] En 2021, la población había disminuido durante quince años consecutivos en 644.000 en comparación con este año, la mayor caída registrada desde 1945 y que también refleja un mínimo histórico de 831.000 nacimientos. En 2013, [update]más del 20 por ciento de la población de Japón tenía 65 años o más. [10]
La población estaba compuesta por 47.062.743 hogares, con un 78,7% en áreas urbanas (julio de 2000). Alta densidad de población; 329,5 personas por kilómetro cuadrado para el área total; 1.523 personas por kilómetro cuadrado para tierra habitable. Más del 50% de la población vive en el 2% de la tierra. (julio de 1993). [11] Según la investigación de 2009, la relación entre la población y la densidad de la tierra ha aumentado gradualmente, ahora en 127 millones por 337 km2. En comparación con los hallazgos de julio de 1993, así como en julio de 2000, la densidad de población ha aumentado considerablemente, del 50% de la población que vive en el 2% de la tierra al 77%. Sin embargo, a medida que han pasado los años desde los últimos registros de la población de Japón, la población de Japón ha disminuido, lo que genera preocupación sobre el futuro de Japón. Las causas son múltiples, como la disminución de la tasa de natalidad y de la proporción de hombres y mujeres desde las últimas mediciones de los años 2006 y 2010. Según el Ministerio de Salud japonés, se estima que la población descenderá de su estado actual de 125,58 millones a 86,74 millones para el año 2060. [12]
Japón pasó del quinto país más poblado del mundo al sexto en 1964, al séptimo en 1978, al octavo en 1990, al noveno en 1998, al décimo a principios del siglo XXI, al undécimo en 2020 y al duodécimo en 2023. [13] [14] Durante el período de 2010 a 2015, la población se redujo en casi un millón, [15] y Japón perdió medio millón solo en 2022. [16] El número de ciudadanos japoneses disminuyó en 801.000 a 122.423.038 en 2022 respecto al año anterior, lo que supuso la disminución más grave y la primera vez que las 47 prefecturas sufrieron un descenso desde el lanzamiento de la encuesta en 1968. La población del país alcanzó los 128.057.352 japoneses a principios de 2010. Sin embargo, los efectos duraderos de la crisis económica japonesa durante la Gran Recesión desaceleraron fuertemente las tasas de inmigración en Japón en la década de 2010.
En marzo de 2011, Japón sufrió un triple desastre ( terremoto, tsunami , desastre nuclear , etc.), que provocó 20.000 muertes, una reducción de alrededor de 1,39 años en la esperanza de vida media, un descenso definitivo de las tasas de natalidad y un marcado descenso de las tasas de inmigración, el peor desde el final de la Segunda Guerra Mundial .
Según estudios del Institute for Health Metrics and Evaluation , desde enero de 2020 hasta finales de septiembre de 2021 como efecto directo de la pandemia de COVID-19 , Japón registró al menos 112.000 muertes en exceso con una tasa seis veces mayor, [17] una reducción de unos 2,6 años en la esperanza de vida media , una notable disminución de las tasas de natalidad y una marcada disminución de las tasas de inmigración, siendo el efecto global una disminución natural récord de la población de 798.214 unidades [ aclaración necesaria ] en ese año, aunque la tasa de exceso de mortalidad por todas las causas se ha estimado entre 100.000 y 130.000 muertes. Es la mayor registrada desde 1914 (en la época de la Primera Guerra Mundial , la pandemia de gripe española y el Gran terremoto de Kanto ). [ aclaración necesaria ]
Según un estudio demográfico realizado por el Ministerio del Interior y Comunicaciones de Japón , la población japonesa (incluidos los residentes extranjeros) ha disminuido de 128 millones de personas en 2010 a 124,3 millones de personas en 2023, con una disminución de casi 511.000 personas en un año. [18] [19]

.svg/1280px-Population_Pyramids_of_Japan_(Projections_2065,IPSS).svg.png)

Japón recopila información censal cada cinco años, y los censos los realiza la Oficina de Estadística del Ministerio del Interior . [21] [22] El último censo de población refleja la situación a fecha de 2020. [22]
Según los Indicadores de Desarrollo Mundial, la densidad de población de Japón era de 336 personas por kilómetro cuadrado en 2014 (874 personas por milla cuadrada). Ocupa el puesto 44 en una lista de países por densidad de población . Entre 1955 y 1989, los precios de la tierra en las seis ciudades más grandes aumentaron un 15.000% (+12% anual compuesto). Los precios de la tierra urbana aumentaron en general un 40% entre 1980 y 1987; en las seis ciudades más grandes, el precio de la tierra se duplicó durante ese período. Para muchas familias, esta tendencia puso la vivienda en las ciudades centrales fuera del alcance. [11]
El resultado fueron largos desplazamientos para muchos trabajadores en las grandes ciudades, especialmente en el área de Tokio , donde los desplazamientos diarios de dos horas por trayecto son habituales. [11] En 1991, cuando la economía de burbuja empezó a desplomarse, los precios de los terrenos empezaron a descender bruscamente y en pocos años cayeron un 60% por debajo de su punto máximo. [23] Tras una década de descenso de los precios de los terrenos, los residentes empezaron a volver a trasladarse a las zonas centrales de la ciudad (especialmente a los 23 distritos de Tokio), como lo demuestran las cifras del censo de 2005. A pesar de que casi el 70% de Japón está cubierto de bosques, [24] los parques de muchas ciudades importantes (especialmente Tokio y Osaka) son más pequeños y escasos que en las principales ciudades de Europa occidental o de América del Norte. En 2014, la superficie de parque por habitante en Tokio es de 5,78 metros cuadrados, [25] lo que supone aproximadamente la mitad de los 11,5 metros cuadrados de Madrid. [26]
Los gobiernos nacionales y regionales dedican recursos a hacer más atractivas las ciudades regionales y las zonas rurales mediante el desarrollo de redes de transporte, servicios sociales, industria e instituciones educativas para tratar de descentralizar los asentamientos y mejorar la calidad de vida. Sin embargo, las grandes ciudades, especialmente Tokio, Yokohama y Fukuoka , y en menor medida Kioto , Osaka y Nagoya , siguen siendo atractivas para los jóvenes que buscan educación y empleo. [11]

Japón tiene una alta concentración de población en áreas urbanas en las llanuras, ya que el 75% de la superficie terrestre de Japón está formada por montañas, [28] y también Japón tiene una tasa de cobertura forestal del 68,5% (los únicos otros países desarrollados con un porcentaje de cobertura forestal tan alto son Finlandia y Suecia). [24] El censo de 2010 muestra que el 90,7% de la población total japonesa vive en ciudades. [29]
Japón es una sociedad urbana en la que sólo el 5% de la fuerza laboral trabaja en la agricultura . Muchos agricultores complementan sus ingresos con trabajos a tiempo parcial en pueblos y ciudades cercanas. Alrededor de 80 millones de la población urbana se concentra en gran medida en la costa del Pacífico de Honshu . [30]
La metrópoli de Tokio - Yokohama , con una población de 35 millones de habitantes, es la ciudad más poblada del mundo. Japón se enfrenta a los mismos problemas que enfrentan las sociedades urbanas industrializadas de todo el mundo: ciudades superpobladas y carreteras congestionadas .
La población de Japón está envejeciendo más rápido que la de cualquier otra nación. [31] La población de 65 años o más aproximadamente se duplicó en 24 años, del 7,1% de la población en 1970 al 14,1% en 1994. El mismo aumento tomó 61 años en Italia , 85 años en Suecia y 115 años en Francia . [32] En 2014, se estimó que el 26% de la población de Japón tenía 65 años o más, [33] y el Ministerio de Salud y Bienestar ha estimado que los mayores de 65 años representarán el 40% de la población para 2060. [34] El cambio demográfico en el perfil de edad de Japón ha provocado preocupaciones sobre el futuro económico de la nación y la viabilidad de su estado de bienestar. [35]


.png/1280px-Live_births_and_deaths_of_Japan_(1946-2019).png)


Fuentes: Our World In Data y Naciones Unidas .
1865–1949
1950–2015


Fuente: Perspectivas de población mundial de las Naciones Unidas
En 2022, la tasa de fecundidad total de Japón era de 1,26, una de las más bajas del mundo y muy por debajo de la tasa de reemplazo de 2,1. El primer ministro japonés, Fumio Kishida, se ha comprometido a tomar medidas urgentes para abordar la caída de la tasa de natalidad del país, calificándola de "ahora o nunca" para la sociedad envejecida de Japón, y planea duplicar el presupuesto para políticas relacionadas con la infancia para junio y crear una nueva agencia gubernamental en abril. [ cita requerida ]

![Mapa de Asia oriental por tasa global de fecundidad (TGF) en 2021. La TGF de Japón en 2012 se estimó en 1,41 hijos por mujer, aumentando ligeramente desde 1,32 en el período 2001-2005. En 2012, la TGF más alta fue 1,90, en Okinawa, y la más baja fue 1,09, en Tokio. Se han publicado las TGF por prefectura para 2000-2005, así como estimaciones futuras.[38]](http://upload.wikimedia.org/wikipedia/commons/thumb/5/55/Map_of_East_Asia_by_TFR_in_2021.png/1280px-Map_of_East_Asia_by_TFR_in_2021.png)

![Porcentaje de nacimientos de mujeres solteras en países seleccionados, 1980 y 2007.[39] Como se puede ver en la figura, Japón no ha seguido la tendencia de otros países industrializados de niños nacidos fuera del matrimonio en el mismo grado.](http://upload.wikimedia.org/wikipedia/commons/thumb/8/87/Percentage_of_birth_to_unmarried_women,_selected_countries,_1980_and_2007.png/1280px-Percentage_of_birth_to_unmarried_women,_selected_countries,_1980_and_2007.png)
Nacimientos vivos, tasas de natalidad y mortalidad, tasa de fertilidad general y cambio neto en Japón desde 1899 hasta la actualidad. Las estadísticas que figuran a continuación no incluyen nacionalidades extranjeras. [40] [41] [42] [43] [44] [45]
[47][48]
Between 6 million and 7 million people moved their residences each year during the 1980s. About 50% of these moves were within the same prefecture; the others were relocations from one prefecture to another. During Japan's economic development in the twentieth century, and especially during the 1950s and 1960s, migration was characterized by urbanization as people from rural areas in increasing numbers moved to the larger metropolitan areas in search of better jobs and education. Out-migration from rural prefectures continued in the late 1980s, but more slowly than in previous decades.[11]
In the 1980s, government policy provided support for new urban development away from the large cities, particularly Tokyo, and assisted regional cities to attract young people to live and work there. Regional cities offered familiarity to those from nearby areas, lower costs of living, shorter commutes, and, in general, a more relaxed lifestyle than could be had in larger cities. Young people continued to move to large cities, however, to attend universities and find work, but some returned to regional cities (a pattern known as U-turn) or to their prefecture of origin (referred to as "J-turn"), or even moved to a rural area for the first time ("I-turn").[11][49]
Government statistics show that in the 1980s significant numbers of people left the largest central cities (Tokyo and Osaka) to move to suburbs within their metropolitan areas. In 1988, more than 500,000 people left Tokyo, which experienced a net loss through migration of nearly 73,000 for the year. Osaka had a net loss of nearly 36,000 in the same year.[11]
With a decreasing total population, internal migration results in only eight prefectures showing an increase in population. These are Okinawa (2.9%), Tokyo (2.7%), Aichi (1.0%), Saitama (1.0%), Kanagawa (0.9%), Fukuoka (0.6%), Shiga (0.2%), and Chiba (0.1%).[50]
About 663,300 Japanese were living abroad, approximately 75,000 of whom had permanent foreign residency, more than six times the number who had that status in 1975. More than 200,000 Japanese went abroad in 1990 for extended periods of study, research, or business assignments. As the government and private corporations have stressed internationalization, greater numbers of individuals have been directly affected, decreasing Japan's historical insularity. By the late 1980s, these problems, particularly the bullying of returnee children in schools, had become a major public issue both in Japan and in Japanese communities abroad.[11]
Cities with significant populations of Japanese nationals in 2015 included:
Note: The above data shows the number of Japanese nationals living overseas. It was published by the Ministry of Foreign Affairs of Japan and relates to 2015.[51]
According to the Japanese immigration centre, the number of foreign residents in Japan has steadily increased, and the number of foreign residents exceeded 3 410 992 people in December 2023.[52][53][54]
In 2020, the number of foreigners in Japan was 2,887,116. This includes 325,000 Filipinos, many of whom are married to Japanese nationals and possessing some degree of Japanese ancestry,[55][56] 208,538 Brazilians, the majority possessing some degree of Japanese ancestry,[56] 778,112 Chinese, 448,053 Vietnamese and 426,908 South Koreans. Chinese, Vietnamese, Koreans, Filipinos and Brazilians account for about 77% of foreign residents in Japan.[citation needed]
The current issue of the shrinking workforce in Japan alongside its aging population has resulted in a recent need to attract foreign labour to the country.[citation needed] Reforms which took effect in 2015 relax visa requirements for "Highly Skilled Foreign Professionals" and create a new type of residence status with an unlimited period of stay.[citation needed]
According to the Civil Affairs Bureau of Japan's Ministry of Justice, the number of naturalized individuals peaked in 2003 at 17,633, before declining to 8,800 by 2023.[57][58][59][60][61] Most of the decline is accounted for by a steep reduction in the number of Japan-born Koreans taking Japanese citizenship. Historically the bulk of those taking Japanese citizenship have not been foreign-born immigrants but rather Japanese-born descendants of Koreans and Taiwanese who lost their citizenship in the Japanese Empire in 1947 as part of the American Occupation policy for Japan.
Japanese statistical authorities do not collect information on ethnicity, only nationality.[62] As a result, both native and naturalized Japanese citizens are counted in a single group.[63] Although official statistics therefore show homogeneity, other analyses describe the population as “multi-ethnic”.[64][65][66]
In addition to the Japanese language, Ryūkyūan languages are spoken in Okinawa and parts of Kagoshima in the Ryūkyū Islands. Along with Japanese, these languages are part of the Japonic language family, but they are separate languages,[citation needed] and are not mutually intelligible with Japanese, or with each other. All of the spoken Ryukyuan languages are classified by UNESCO as endangered.
In Hokkaidō, there is the Ainu language, which is spoken by the Ainu people, who are the indigenous people of the island. The Ainu languages, of which Hokkaidō Ainu is the only extant variety, are isolated and do not fall under any language family. Ever since the Meiji period, Japanese has become widely used among the Ainu people and consequently Ainu languages have been classified critically endangered by UNESCO.[68]
In addition, languages such as Orok, Evenki and Nivkh spoken in formerly Japanese controlled southern Sakhalin are becoming more and more endangered. After the Soviet Union took control of the region, speakers of these languages and their descendants migrated to mainland Japan and still exist in small numbers.The Japanese society of Yamato people is linguistically homogeneous with small populations of Koreans (0.9 million), Chinese/Taiwanese (0.65 million), Filipino (306,000 some being Japanese Filipino; children of Japanese and Filipino parentage).[69] This can be also said for Brazilians (300,000, many of whom are ethnically Japanese) as well as Peruvians and Argentineans of both Latin American and Japanese descent.[citation needed] Japan has indigenous minority groups such as the Ainu and Ryukyuans, who generally speak Japanese.
Japanese citizenship is conferred jure sanguinis, and monolingual Japanese-speaking minorities often reside in Japan for generations under permanent residency status without acquiring citizenship in their country of birth, although legally they are allowed to do so. This is because Japanese law does not recognize dual citizenship after the age of adulthood, and so people becoming naturalized Japanese citizens must relinquish their previous citizenship upon reaching the age of 22 years [70][71]
In addition, people taking Japanese citizenship must take a name using one or more of the Japanese character sets (hiragana, katakana, kanji). Names written in the Western alphabet, Korean alphabet, Arabic characters, etc., are not acceptable as legal names. Chinese characters are usually legally acceptable as nearly all Chinese characters are recognized as valid by the Japanese government. Transliterations of non-Japanese names using katakana (e.g. スミス "Sumisu" for "Smith") are also legally acceptable.[citation needed]
However, some naturalizing foreigners feel that becoming a Japanese citizen should mean that they have a Japanese name and that they should abandon their foreign name, and some foreign residents do not wish to do this—although most Special Permanent Resident Koreans and Chinese already use Japanese names. Nonetheless, some 10,000 Zainichi Koreans naturalize every year. Approximately 98.6% of the population are Japanese citizens, and 99% of the population speak Japanese as their first language. Non-ethnic Japanese in the past, and to an extent in the present, also live in small numbers in the Japanese archipelago.[64]
Japanese people enjoy a high standard of living, and nearly 90% of the population consider themselves part of the middle class.[11] However, many studies on happiness and satisfaction with life tend to find that Japanese people average relatively low levels of life satisfaction and happiness when compared with most of the highly developed world; the levels have remained consistent if not declining slightly over the last half century.[72][73][74][75] Japanese have been surveyed to be relatively lacking in financial satisfaction.[76] The societal view generally disapproves of out-of-wedlock births and premarital pregnancies.[77]
Social isolation is a problem for a segment of Japanese society, with almost 500,000 young people belonging to this group, they are also known as hikikomori.[78]
The Japanese management working culture in Japan has led some to work-related deaths due to heart attack or stroke, this has led to the term karoshi (lit. "overwork death"). The government has received 200 claims of karoshi related work injuries each year, with some leading to suicide.[79]
Many Japanese lead a sexless marriage. Japan has the lowest level of couples having sex at 45 times per year, well below the global average of 103 times. With reasons of "tired" and "bored with intercourse" usually given as an answer.[80] Despite this, Japan ranks as number two globally on the amount spent on pornography, after South Korea.[81][82]


Naturalized Japanese citizens and native-born Japanese nationals with a multi-ethnic background are all considered to be Japanese in the population census of Japan.[63]
Three native Japanese minority groups can be identified. The largest are the hisabetsu buraku or "discriminated communities", also known as the burakumin. These descendants of premodern outcast hereditary occupational groups, such as butchers, leatherworkers, funeral directors, and certain entertainers, may be considered a Japanese analog of India's Dalits. Historically, discrimination against these occupational groups was based on Buddhist prohibitions on killing and Shinto notions of pollution, and it was also a feature of governmental attempts to maintain social control.[11]
During the Edo period, such people were required to live in special buraku and, like the rest of the population, they were bound by sumptuary laws which were based on the inheritance of social class. The Meiji government abolished most of the derogatory names which were applied to these discriminated communities in 1871, but the new laws had little effect on the social discrimination which was faced by the former outcasts and their descendants. However, the laws eliminated the economic monopoly which they had on certain occupations.[11] The buraku continued to be treated as social outcasts and some casual interactions with the majority caste were perceived taboo until the era after World War II.
Estimates of their number range from 2 to 4 million (about 4% of the national population in 2022). Although the members of these marginalized communities are physically indistinguishable from other Japanese, most of them live in urban ghettoes or they live in the traditional special hamlets which are located in rural areas, and as a result, membership in a marginalized group can be surmised from the location of a family's home, a family's occupation, the dialect which a family speaks, or the mannerisms which a family uses when it communicates with people. Checks on the backgrounds of families which were designed to ferret out buraku were commonly performed as a condition of marriage arrangements and employment applications,[11] but in Osaka, they have been illegal since 1985.
Among the hisabetsu buraku, past and current discrimination against them has resulted in lower educational attainments and it has also resulted in a lower socioeconomic status, by contrast, the majority of Japanese have higher educational attainments and they also have a higher economic status. Movements with objectives which range from "liberation" to the encouragement of integration have attempted to change this situation,[11] with some success. Nadamoto Masahisa of the Buraku History Institute estimates that as of 1998, between 60 and 80% of burakumin marry a non-burakumin.[83]
One of the largest minority groups among Japanese citizens is the Ryukyuan people.[84] They are primarily distinguished by their use of several distinct Ryukyuan languages, though use of Ryukyuan is dying out.[85] The Ryukyuan people and language originated in the Ryukyu Islands, which are in Okinawa prefecture and Kagoshima Prefecture.

The third largest minority group among Japanese citizens is the Ainu, whose language is an isolate. Historically, the Ainu were an indigenous hunting and gathering population who occupied most of northern Honshū as late as the Nara period (A.D. 710–94). As Japanese settlement expanded, the Ainu were pushed northward,[11] by the Tokugawa shogunate, the Ainu were pushed into the island of Hokkaido.[86]
Characterized as remnants of a primitive circumpolar culture, the fewer than 20,000 Ainu in 1990 were considered racially distinct and thus not fully Japanese. Disease and a low birth rate had severely diminished their numbers over the past two centuries, and intermarriage had brought about an almost completely mixed population.[11]
Although no longer in daily use, the Ainu language is preserved in epics, songs, and stories transmitted orally over succeeding generations. Distinctive rhythmic music and dances and some Ainu festivals and crafts are preserved, but mainly in order to take advantage of tourism.[11]
Hāfu (a kana rendition of "half") is a term used for people who are biracial and ethnically half Japanese. Of the one million children born in Japan in 2013, 2.2% had one or two non-Japanese parents.[70] According to the Japanese Ministry of Health, Labor and Welfare, one in forty-nine babies born in Japan today are born into families with one non-Japanese parent.[87] Most intermarriages in Japan are between Japanese men and women from other Asian countries, including China, the Philippines and South Korea.[88] Southeast Asia too, also has significant populations of people with half-Japanese ancestry, particularly in the Philippines, Indonesia, Malaysia, Singapore and Thailand.
In the 1940s, biracial Japanese children (Ainoko), specifically Amerasian children, encountered social problems such as poverty, perception of impurity and discrimination due to negative treatment in Japan.[89] In the 21st century, discrimination against hāfu occurs based on how different their identity, behavior and appearance is from a typical Japanese person.[90]
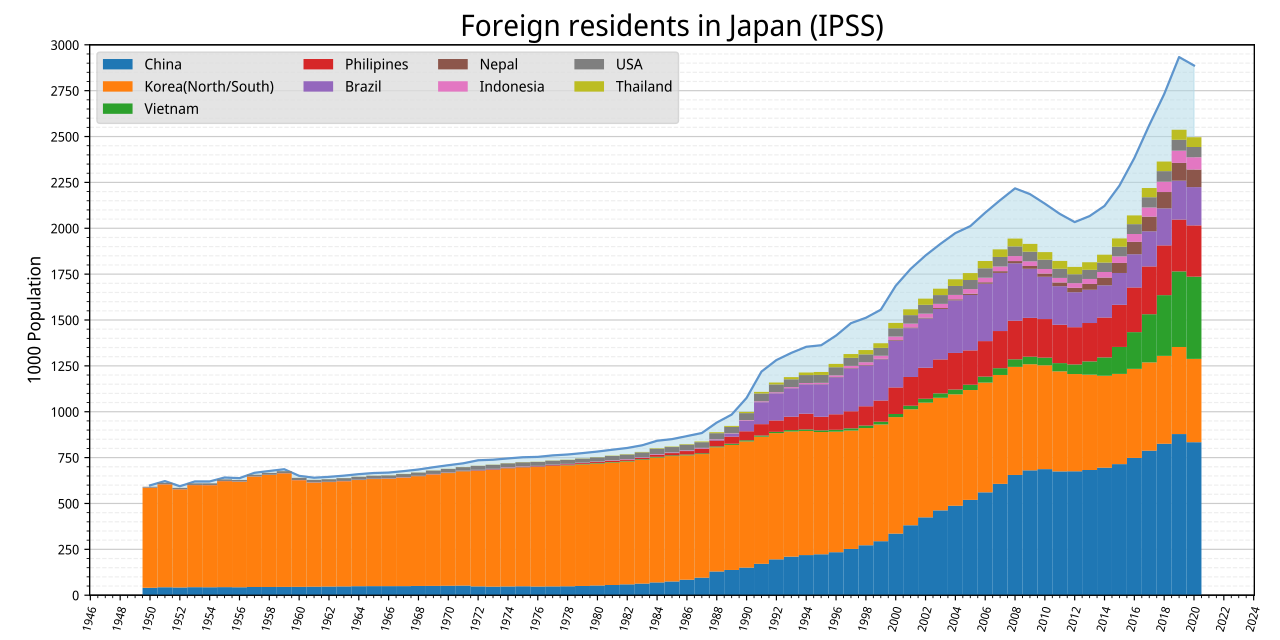

In 2021, there were 2,887,116 foreign residents in Japan, representing 2.3% of the Japanese population.[91] Foreign Army personnel, of which there were up to 430,000 from the SCAP (post-occupation, United States Forces Japan) and 40,000 BCOF in the immediate post-war years, have not been at any time included in Japanese foreign resident statistics.[92] Most foreign residents in Japan come from Brazil or from other Asian countries, particularly from China, Vietnam, South Korea, the Philippines, and Nepal.[93][94]
A number of long-term resident Koreans in Japan today retain familial links with the descendants of Koreans,[95] that either immigrated voluntarily or were forcibly relocated during the Japanese occupation of Korea. Within this group, a number hold Special Permanent Resident status, granted under the terms of the Normalisation Treaty (22. June 1965) between South Korea and Japan.[96] In many cases special residents, despite being born in Japan and speaking Japanese, have chosen not to take advantage of the mostly automatic granting of citizenship to special resident applicants.[97]
Beginning in 1947 the Japanese government started to repatriate Korean nationals, who had nominally been granted Japanese citizenship during the years of military occupation. When the Treaty of San Francisco came into force many ethnic Koreans lost their Japanese citizenship from April 28, 1952, and with it the right to welfare grants, to hold a government job of any kind or to attend Japanese schools.[92] In the following year the government contrived, with the help of the Red Cross, a scheme to "repatriate" Korean residents, who mainly were from the Southern Provinces, to their "home" of North Korea.[98] Between 1959 and 1984 93,430 people used this route, of whom 6,737 were Japanese or Chinese dependents. Most of these departures – 78,276 – occurred before 1962.[99]
.png/1280px-Foreign_nationals_living_in_Japan_(2023).png)
All non-Japanese without special residential status (people whose residential roots go back to before WWII) are required by law to register with the government and carry alien registration cards. From the early 1980s, a civil disobedience movement encouraged refusal of the fingerprinting that accompanied registration every five years.[11]
Opponents of fingerprinting argued that it was discriminatory because the only Japanese who were fingerprinted were criminals. The courts upheld fingerprinting, but the law was changed so that fingerprinting was done once rather than with each renewal of the registration,[11] which until a law reform in 1989 was usually required every six months for anybody from the age of 16. Those refusing fingerprinting were denied re-entry permits, thus depriving them of freedom of movement.
Of these foreign residents below, the new wave started in 2014 comes to Japan as students or trainees. These foreigners are registered under student visa or trainee visa, which gives them the student residency status. Most of these new foreigners are under this visa. Almost all of these foreign students and trainees will return to their home country after three to four years (one valid period); few students extend their visa. Vietnamese makes the largest increase, however Burmese, Cambodians, Filipinos and Chinese are also increasing.
Asian migrant wives of Japanese men have also contributed to the foreign-born population in the country. Many young single Japanese male farmers choose foreign wives, mainly from the Philippines, Thailand, China and South Korea, due to a lack of interest from Japanese women living a farming life.[101] Migrant wives often travel as mail-order brides as a result of arranged marriages with Japanese men.[102]
There was an increase of 110,358 foreign residents from 2014 to 2015. Vietnamese made the largest proportion of these new foreign residents, whilst Nepalese, Filipino, Chinese and Taiwanese are also significant in numbers. Together these countries makes up 91,126 or 82.6% of all new residents from 2014 to 2015. However, the majority of these immigrants will only remain in Japan for a maximum of five years, as many of them have entered the country in order to complete trainee programmes. Once they complete their programmes, they will be required to return to their home countries.[115]
As of December 2014 there were 2,121,831 foreigners residing in Japan, 677,019 of whom were long-term residents in Japan, according to national demographics figures. The majority of long-term residents were from Asia, totalling 478,953. Chinese made up the largest portion of them with 215,155, followed by Filipinos with 115,857, and Koreans with 65,711. Thai, Vietnamese, and Taiwanese long-term residents totaled 47,956, and those from other Asian countries totaled 34,274. The Korean figures do not include zainichi Koreans with tokubetsu eijusha ("special permanent resident") visas, of whom there were 354,503 (of a total of 358,409 of all nationalities with such visas). The total number of permanent residents had declined over the previous five years due to high cost of living.[105]
The number of foreign residents of Japan reached a high of 2.93 million in 2019 before falling to 2.76 million at the end of 2021.[116] The number of foreign workers was 1.46 million in 2018, 29.7% are in the manufacturing sector; 389,000 are from Vietnam and 316,000 are from China.[117]
On April 1, 2019, Japan's revised immigration law was enacted. The revision clarifies and better protects the rights of foreign workers. Japan formally accepts foreign blue-collar workers. This helps reduce labour shortage in certain sectors of the economy. The reform changes the status of foreign workers to regular employees and they can obtain permanent residence status. The reform includes a new visa status called tokutei gino (特定技能, "designated skills"). In order to qualify, applicants must pass a language and skills test (level N4 or higher of the Japanese-Language Proficiency Test). In the old "Technical Trainee programme" a foreign employee was tied to their employer. This caused numerous cases of exploitation. The revision gives foreign workers more freedom to leave and change their employer.[118]

![Foreign nationality (1.9% total)[t 1]](http://upload.wikimedia.org/wikipedia/commons/thumb/4/45/Percentage_of_Japan_who_is_of_Foreign_nationality_in_2020.svg/1280px-Percentage_of_Japan_who_is_of_Foreign_nationality_in_2020.svg.png)


Shinto and Buddhism are Japan's two major religions. They have co-existed for more than a thousand years. However, most Japanese people generally do not exclusively identify themselves as adherents of one religion, but rather incorporate various elements in a syncretic fashion.[119] There are small Christian and other minorities as well, with the Christian population dating to as early as the 1500s, as a result of European missionary work before sakoku was implemented from 1635 to 1853.
{{cite web}}: CS1 maint: archived copy as title (link){{cite web}}: CS1 maint: archived copy as title (link){{cite book}}: CS1 maint: location missing publisher (link) CS1 maint: others (link)
